
Mathematics, 01.09.2019 19:30 jakhunter354
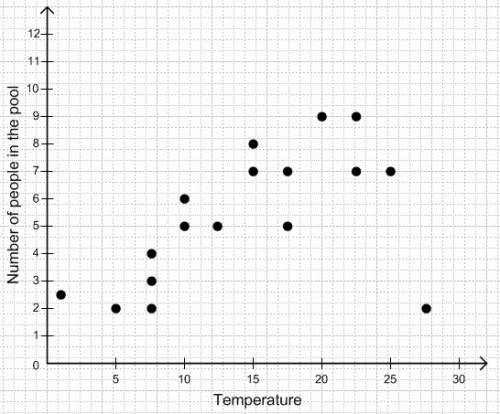
Meg plotted the graph below to show the relationship between the temperature of her city and the number of people at a swimming pool:
main title on the graph is swimming pool population. graph shows 0 to 30 on x axis at increments of 5 and 0 to 12 on y axis at increments of 1. the label on the x axis is temperature in degree c, and the label on the y axis is number of people at the pool. dots are made at the ordered pairs 2.5, 1 and 5, 2 and 7.5, 2 and 7.5, 3 and 7.5, 4 and 10, 5 and 10, 6 and 12.5, 6 and 15, 7 and 15, 8 and 17.5, 5 and 17.5, 7 and 20, 9 and 22.5, 7 and 22.5, 9 and 25, 11 and 27.5, 12.
part a: in your own words, describe the relationship between the temperature of the city and the number of people at the swimming pool. (5 points)
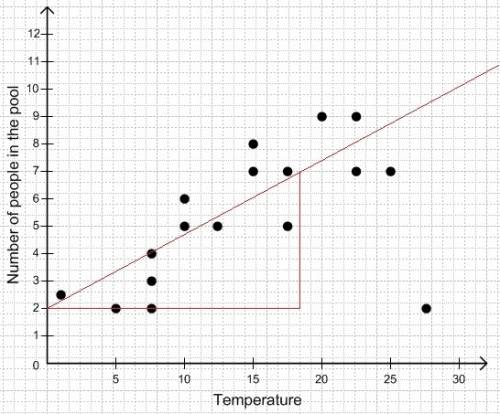
part b: describe how you can make the line of best fit. write the approximate slope and y-intercept of the line of best fit. show your work, including the points that you use to calculate slope and y-intercept. (5 points)

Answers: 1


Another question on Mathematics
Mathematics, 21.06.2019 16:30
Which of the following is the correct ratio for converting kilograms to grams
Answers: 3
Mathematics, 21.06.2019 18:00
What is the solution to the equation in the & show work i’m very
Answers: 1
Mathematics, 21.06.2019 19:00
Write and solve a real word problem that involves determining distance on a coordinate plane
Answers: 1
Mathematics, 21.06.2019 20:30
Three numbers x, y, and z are in the ratio 2: 7: 8. if 12 is subtracted from y, then three numbers form a geometric sequence (in the order x, y–12, z). find x, y, and z. there are 2 sets.
Answers: 1
You know the right answer?
Meg plotted the graph below to show the relationship between the temperature of her city and the num...
Questions
Mathematics, 07.09.2021 01:20

English, 07.09.2021 01:20
Mathematics, 07.09.2021 01:20

Chemistry, 07.09.2021 01:20
Mathematics, 07.09.2021 01:20

History, 07.09.2021 01:20
Mathematics, 07.09.2021 01:20
Mathematics, 07.09.2021 01:20


Social Studies, 07.09.2021 01:20
Mathematics, 07.09.2021 01:20
Mathematics, 07.09.2021 01:20
Mathematics, 07.09.2021 01:20


