
Mathematics, 08.10.2019 05:30 phillswift2020
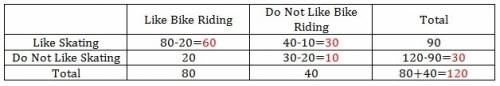
Agroup of students were surveyed to find out if they like bike riding and/or roller skating as a hobby. the results of the survey are shown below:
80 students like bike riding
20 students like bike riding but do not like skating
90 students like skating
40 students do not like bike riding
make a two-way table to represent the data and use the table to answer the following questions.
part a: what percentage of the total students surveyed like both bike riding and skating? show your work. (5 points)
part b: what is the probability that a student who does not like bike riding also does not like skating?

Answers: 1


Another question on Mathematics
Mathematics, 20.06.2019 18:04
Point e(−5, 3) and point d(−4, −3) are located on the grid. which measurement is closest to the distance between point e and point d in units? a) 6.1 units b) 6.3 units c) 6.5 units d) 6.7 units
Answers: 2
Mathematics, 21.06.2019 19:30
Can someone me with the property questions for 12 13 and 14 plz
Answers: 2
Mathematics, 21.06.2019 19:50
How do i simply this expression (quadratic formula basis) on a ti-84 or normal calculator?
Answers: 3
Mathematics, 21.06.2019 23:30
Apyramid fits exactly inside a cube. the cube and the pyramid share the same square base, and they are both exactly the same height. the volume of the cube is 66 cubic inches. what is the volume of the pyramid? explain your answer. answer asap
Answers: 1
You know the right answer?
Agroup of students were surveyed to find out if they like bike riding and/or roller skating as a hob...
Questions

English, 24.05.2020 19:59


Mathematics, 24.05.2020 19:59


Mathematics, 24.05.2020 19:59


