

I'll fan
the graph below shows the height of a kicked soccer ball f(x), in feet, depending on...

Mathematics, 02.11.2019 23:31 joelpimentel
I'll fan
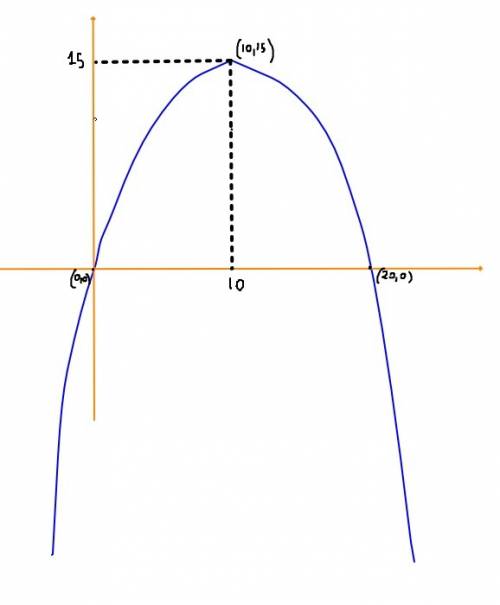
the graph below shows the height of a kicked soccer ball f(x), in feet, depending on the distance from the kicker x, in feet:
graph of quadratic function f of x having x intercepts at ordered pairs 0, 0 and 0, 20. the vertex is at 10, 15.
part a: what do the x-intercepts and maximum value of the graph represent? what are the intervals where the function is increasing and decreasing, and what do they represent about the distance and height? (6 points)
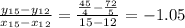
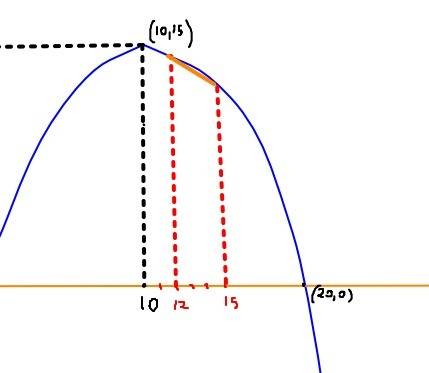
part b: what is an approximate average rate of change of the graph from x = 12 to x = 15, and what does this rate represent? (4 points)

Answers: 2


Another question on Mathematics
Mathematics, 21.06.2019 18:00
Arecipe calls for 32 fluid ounces of heavy cream.how many 1 pint containers of heavy cream are needed to make the recipe?
Answers: 2
Mathematics, 21.06.2019 20:00
If the simple annual interest rate on a loan is 6, what is the interest rate in percentage per month?
Answers: 1
Mathematics, 21.06.2019 20:20
One of every 20 customers reports poor customer service on your company’s customer satisfaction survey. you have just created a new process that should cut the number of poor customer service complaints in half. what percentage of customers would you expect to report poor service after this process is implemented? 1.) 5% 2.) 10% 3.) 2% 4.) 2.5%
Answers: 1
Mathematics, 21.06.2019 20:30
Solve each quadratic equation by factoring and using the zero product property. 14x - 49 = x^2
Answers: 2
You know the right answer?
Questions

Mathematics, 12.11.2019 04:31
Mathematics, 12.11.2019 04:31
Mathematics, 12.11.2019 04:31

Biology, 12.11.2019 04:31

Health, 12.11.2019 04:31

Mathematics, 12.11.2019 04:31

Spanish, 12.11.2019 04:31


