the graph shows two lines, q and s.

Mathematics, 10.10.2019 02:00 ZenmasterZack
Can someone explain? i don't understand
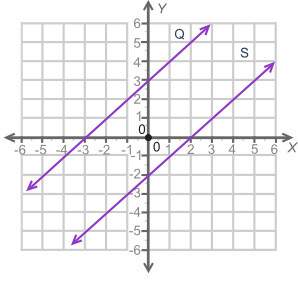
the graph shows two lines, q and s.
a coordinate plane is shown with two lines graphed. line q has a slope of one half and crosses the y axis at 3. line s has a slope of one half and crosses the y axis at negative 2.
how many solutions are there for the pair of equations for lines q and s? explain your answer.

Answers: 3


Another question on Mathematics
Mathematics, 21.06.2019 16:40
Which of the following is most likely the next step in the series? a3z, b6y, c9x, d12w, е15v, f18u
Answers: 2
Mathematics, 21.06.2019 20:00
Evaluate the discriminant of each equation. tell how many solutions each equation has and whether the solutions are real or imaginary. x^2 + 4x + 5 = 0
Answers: 2
Mathematics, 21.06.2019 20:00
Bernice paid $162 in interest on a loan of $1800 borrowed at 6%. how long did it take her to pay the loan off?
Answers: 1
Mathematics, 21.06.2019 20:30
How do you determine if an ordered pair is a solution to a given equation?
Answers: 1
You know the right answer?
Can someone explain? i don't understand
the graph shows two lines, q and s.
the graph shows two lines, q and s.
Questions

Chemistry, 29.08.2019 11:50


Mathematics, 29.08.2019 11:50


Mathematics, 29.08.2019 11:50


Mathematics, 29.08.2019 11:50


