 ÷
÷ =
= or 3.33 times likely
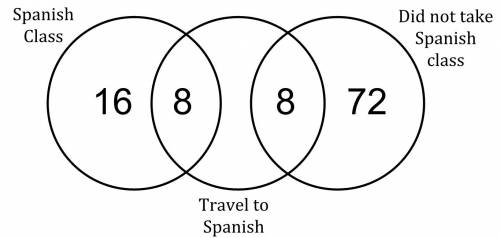
The diagram below represents three groups of students:
s (blue and green): the set of stude...

Mathematics, 26.10.2019 21:43 mandilynn22
The diagram below represents three groups of students:
s (blue and green): the set of students who took a spanish class.
t (green and orange): the set of students who traveled to a spanish-speaking country.
d (red and orange): the set of students who did not take a spanish class. each block represents one student.
how many times more likely is it for a student who took spanish to have traveled to a spanish-speaking country than a student who did not take spanish?
a. it is 2.3 times as likely.
b. it is 3.3 times as likely.
c. it is 23 times as likely.
d. it is 30 times as likely.

Answers: 3


Another question on Mathematics
Mathematics, 20.06.2019 18:04
What is the difference of the fractions use the number line and equivalent fractions to find the answer -2 1 2 -1-34 i’m already started the quiz
Answers: 3
Mathematics, 21.06.2019 21:00
Select the correct answer from each drop-down menu. a system of equations and its solution are given below. system a complete the sentences to explain what steps were followed to obtain the system of equations below. system b to get system b, the equation in system a was replaced by the sum of that equation and times the equation. the solution to system b the same as the solution to system a.]
Answers: 1
Mathematics, 21.06.2019 21:30
Jonathan can type 20 documents in 40 minutes ,and susan can type it in 30 minutes and jack can type it in 24 minutes working together ,how much time will it is take them type the same document
Answers: 1
Mathematics, 22.06.2019 00:30
Officer brimberry wrote 32 tickets for traffic violations last week, but only 4 tickets this week. what is the percent decrease? give your answer to the nearest tenth of a percent.
Answers: 1
You know the right answer?
Questions


History, 17.11.2020 08:50

Biology, 17.11.2020 08:50
Mathematics, 17.11.2020 08:50
Mathematics, 17.11.2020 08:50


French, 17.11.2020 08:50

English, 17.11.2020 08:50
English, 17.11.2020 08:50
Mathematics, 17.11.2020 08:50
Mathematics, 17.11.2020 08:50

Advanced Placement (AP), 17.11.2020 08:50


