
Mathematics, 21.09.2019 16:10 thanks5640
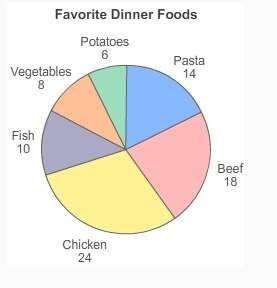
The graph shows the results of a survey that asked people to choose their favorite dinner foods. one of the persons surveyed is chosen at random. what is the probability that he chose pasta?
a.) 22.5%
b.) 17.5%
c.) 14%
d.) 12.5%


Answers: 1


Another question on Mathematics
Mathematics, 21.06.2019 16:30
Which choice represents the sample space ,s for this event
Answers: 3
Mathematics, 21.06.2019 16:50
An angle that measures between 90 and 180° is called a(,
Answers: 2
Mathematics, 21.06.2019 23:00
You buy a veido game for $60 and the sales tax is 8% what is the total cost for the game including the sales tax
Answers: 1
Mathematics, 22.06.2019 01:30
Jahdzia wears her winter coat when the temperature is colder than -4 degrees celsius. write an inequality that is true only for temperatures (t) at which jahdzia wears her winter coat.
Answers: 3
You know the right answer?
The graph shows the results of a survey that asked people to choose their favorite dinner foods. one...
Questions


Physics, 06.11.2020 17:10


Computers and Technology, 06.11.2020 17:10


