Me! i believe this would be easy.
the graph below shows roy's distance from his office...

Mathematics, 05.10.2019 06:20 jebjeb6135
Me! i believe this would be easy.
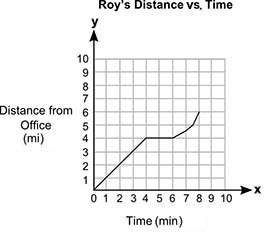
the graph below shows roy's distance from his office (y), in miles, after a certain amount of time (x), in minutes:
four students described roy's motion, as shown in the table below:
student description
peter he drives a car at a constant speed for 4 minutes, then stops at a crossing for 6 minutes, and finally drives at a variable speed for the next 2 minutes.
shane he drives a car at a constant speed for 4 minutes, then stops at a crossing for 2 minutes, and finally drives at a variable speed for the next 8 minutes.
jamie he drives a car at a constant speed for 4 minutes, then stops at a crossing for 6 minutes, and finally drives at a variable speed for the next 8 minutes.
felix he drives a car at a constant speed for 4 minutes, then stops at a crossing for 2 minutes, and finally drives at a variable speed for the next 2 minutes.
which student most accurately described roy's motion?
peter
shane
jamie
felix

Answers: 2


Another question on Mathematics
Mathematics, 21.06.2019 15:10
Which equation represents the partial sum of the geometric series?
Answers: 1
Mathematics, 22.06.2019 00:00
Cd is the perpendicular bisector of both xy and st, and cy=20. find xy.
Answers: 1
You know the right answer?
Questions
Mathematics, 12.12.2020 15:50

Chemistry, 12.12.2020 15:50

Advanced Placement (AP), 12.12.2020 15:50
Mathematics, 12.12.2020 15:50
Mathematics, 12.12.2020 15:50
Mathematics, 12.12.2020 15:50

History, 12.12.2020 15:50
History, 12.12.2020 15:50
Mathematics, 12.12.2020 15:50
Chemistry, 12.12.2020 15:50


Biology, 12.12.2020 15:50
Chemistry, 12.12.2020 15:50
Mathematics, 12.12.2020 15:50


