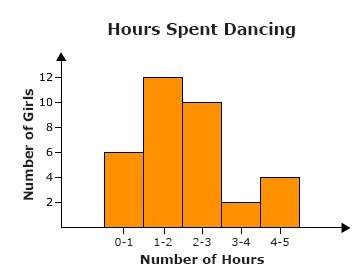
The number of hours girls spent dancing last week is shown in the histogram below.
which...

Mathematics, 03.01.2020 16:31 gaby8282
The number of hours girls spent dancing last week is shown in the histogram below.
which of the following statements is true for the data?
a.
the majority of girls spent 1 hour to 3 hours dancing.
b.
the majority of girls spent 1 hour to 2 hours dancing.
c.
the majority of girls spent 4 hours to 5 hours dancing.
d.
the majority of girls spent 3 hours to 5 hours dancing.

Answers: 2


Another question on Mathematics
Mathematics, 21.06.2019 18:00
Ijust need to see how to do this. so you don’t have to answer all of them just a step by step explanation of one.
Answers: 3
Mathematics, 21.06.2019 19:00
What will the graph look like for a system of equations that has no solution? a. the lines will be perpendicular. b. the lines will cross at one point. c. both equations will form the same line. d. the lines will be parallel.
Answers: 1
You know the right answer?
Questions
Mathematics, 15.07.2021 22:30
Mathematics, 15.07.2021 22:30
Mathematics, 15.07.2021 22:30


Mathematics, 15.07.2021 22:30

Mathematics, 15.07.2021 22:30
Mathematics, 15.07.2021 22:30
Mathematics, 15.07.2021 22:30
Mathematics, 15.07.2021 22:30

Mathematics, 15.07.2021 22:30
Mathematics, 15.07.2021 22:30
Chemistry, 15.07.2021 22:30
History, 15.07.2021 22:50


