
Mathematics, 30.01.2020 00:49 moutchyjoseph
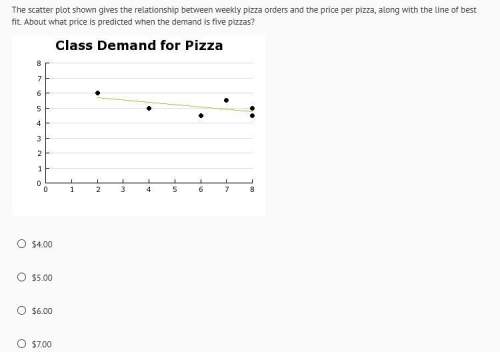
The scatter plot shown gives the relationship between weekly pizza orders and the price per pizza, along with the line of best fit. about what price is predicted when the demand is five pizzas?
i'm not sure of the answer ,and i'm not that good with graphs. so for ,who ever responds : )
here's the answer choices:
a) $4.00
b) $5.00
c) $6.00
d) $7.00

Answers: 2


Another question on Mathematics
Mathematics, 21.06.2019 13:30
Which equation represents a proportional relationship that has a constant of proportionality equal to 1/5
Answers: 1
Mathematics, 21.06.2019 18:30
Can someone check if i did this right since i really want to make sure it’s correct. if you do you so much
Answers: 1
Mathematics, 21.06.2019 23:00
Jane’s favorite fruit punch consists of pear, pineapple, and plum juices in the ratio 5: 2: 3. how many cups of pear juice should she use to make 20 cups of punch?
Answers: 1
You know the right answer?
The scatter plot shown gives the relationship between weekly pizza orders and the price per pizza, a...
Questions

Mathematics, 27.07.2019 09:30


History, 27.07.2019 09:30


Biology, 27.07.2019 09:30
Biology, 27.07.2019 09:30
English, 27.07.2019 09:30

Arts, 27.07.2019 09:30
History, 27.07.2019 09:30
History, 27.07.2019 09:30
Mathematics, 27.07.2019 09:30


