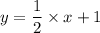
 i.e. y = one half x + 1
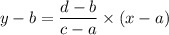
*! 27 ! **
the line of best fit for a scatter plot is shown:
1. a scatter plot...

Mathematics, 29.09.2019 21:00 tioneetionee2188
*! 27 ! **
the line of best fit for a scatter plot is shown:
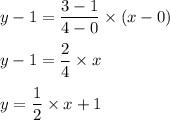
1. a scatter plot and line of best fit are shown. data points are located at 0 and 1, 2 and 1, 2 and 3, 4 and 3, 4 and 5, 6 and 3, 7 and 5, 9 and 4. a line of best fit passes through the y-axis at 1 and through the point 4 and 3.
what is the equation of this line of best fit in slope-intercept form?
y = 1x + one half
y = one half x + 1
y = 1x − one half
y = negative one half x + 1
2. a graph shows the survey results for a group of students who were asked how many honors classes they have taken and how many elective classes:
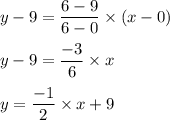
a scatter plot is shown with the title class choices. the x axis is labeled number of honors classes and the y axis is labeled number of electives. data points are located at 1 and 8, 3 and 6, 3 and 9, 5 and 3, 6 and 6, 6 and 9, 8 and 6. a line of best fit crosses the y axis at 9 and passes through the point 6 and 6.
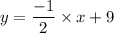
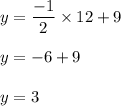
how many elective classes would students likely have taken if they have taken 12 honors classes?
15, because y = one halfx + 9
12, because y = y = negative one halfx + 9
6, y = ˜one halfx + 9
3, because y = negative one halfx + 9

Answers: 2


Another question on Mathematics
Mathematics, 21.06.2019 12:50
best answer for the question.1. divide 7/24 by 35/48 and reduce the quotient to the lowest fraction.
Answers: 2
Mathematics, 21.06.2019 17:30
The table shows the balance of a money market account over time. write a function that represents the balance y (in dollars) after t years.
Answers: 3
Mathematics, 21.06.2019 20:30
Jose is going to use a random number generator 500500 times. each time he uses it, he will get a 1, 2, 3,1,2,3, or 44.
Answers: 1
Mathematics, 21.06.2019 22:40
Explain in a minimum of 2 sentences how to graph the equation of the absolute value function given a vertex of (-1,3) and a value of “a” equal to ½.
Answers: 2
You know the right answer?
Questions
Mathematics, 24.07.2019 03:20


Biology, 24.07.2019 03:30

Mathematics, 24.07.2019 03:30
Biology, 24.07.2019 03:30
Mathematics, 24.07.2019 03:30

History, 24.07.2019 03:30

Social Studies, 24.07.2019 03:30
Biology, 24.07.2019 03:30
Mathematics, 24.07.2019 03:30
Mathematics, 24.07.2019 03:30
History, 24.07.2019 03:30


