
Mathematics, 19.01.2020 18:31 misst002
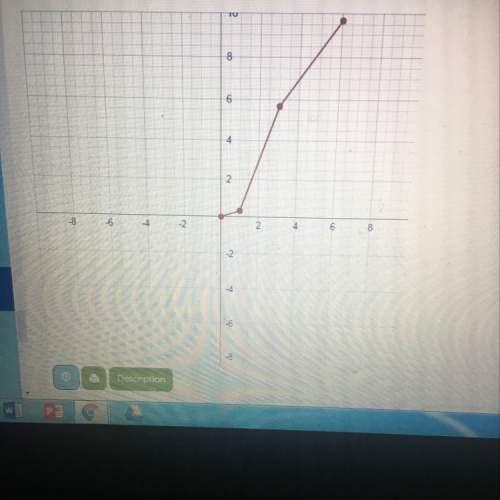
Note the graph of an athletes performance after finishing a triathlon. the x-axis measures time in hours, and the y axis measures distance in kilometers. first she swam, then biked, and then she finished the race with a run. the data states she ran four times as fast as she swam and she biked twice as fast and she ran. based on the graph, chose the statement below that is false.
a) the steeper the segment, the faster the athlete is traveling along the course
b) the athlete finished the course in under eight hours
c) the athlete spent equal amounts of time biking and running
d) the athlete spent twice as much time biking compared to swimming

Answers: 2


Another question on Mathematics
Mathematics, 21.06.2019 17:50
To solve the system of equations below, grace isolated the variable y in the first equation and then substituted into the second equation. what was the resulting equation? 3y=12x x^2/4+y^2/9=1
Answers: 1
Mathematics, 22.06.2019 01:30
One side of a rectangle is 7 centimeters shorter than six times the other side. find the length of the longer side if we also know that the perimeter of the rectangle is 266 centimeters.
Answers: 2
Mathematics, 22.06.2019 02:30
Jennifer is 20 miles north of her house, and she is driving north on the highway at a rate of 55 miles per hour whats the slpoe
Answers: 2
Mathematics, 22.06.2019 03:00
Describe how the presence of possible outliers might be identified on the following. (a) histograms gap between the first bar and the rest of bars or between the last bar and the rest of bars large group of bars to the left or right of a gap higher center bar than surrounding bars gap around the center of the histogram higher far left or right bar than surrounding bars (b) dotplots large gap around the center of the data large gap between data on the far left side or the far right side and the rest of the data large groups of data to the left or right of a gap large group of data in the center of the dotplot large group of data on the left or right of the dotplot (c) stem-and-leaf displays several empty stems in the center of the stem-and-leaf display large group of data in stems on one of the far sides of the stem-and-leaf display large group of data near a gap several empty stems after stem including the lowest values or before stem including the highest values large group of data in the center stems (d) box-and-whisker plots data within the fences placed at q1 â’ 1.5(iqr) and at q3 + 1.5(iqr) data beyond the fences placed at q1 â’ 2(iqr) and at q3 + 2(iqr) data within the fences placed at q1 â’ 2(iqr) and at q3 + 2(iqr) data beyond the fences placed at q1 â’ 1.5(iqr) and at q3 + 1.5(iqr) data beyond the fences placed at q1 â’ 1(iqr) and at q3 + 1(iqr)
Answers: 1
You know the right answer?
Note the graph of an athletes performance after finishing a triathlon. the x-axis measures time in h...
Questions

Mathematics, 10.02.2021 22:50
Mathematics, 10.02.2021 22:50


History, 10.02.2021 22:50
Mathematics, 10.02.2021 22:50
Mathematics, 10.02.2021 22:50

English, 10.02.2021 22:50
Mathematics, 10.02.2021 22:50
Mathematics, 10.02.2021 22:50
Mathematics, 10.02.2021 22:50
Mathematics, 10.02.2021 22:50
Mathematics, 10.02.2021 22:50

Mathematics, 10.02.2021 22:50
Mathematics, 10.02.2021 22:50

Law, 10.02.2021 22:50


