The graph compares shoe sizes for a group of 100 two-year-old boys and a
group of 60 three-yea...

Mathematics, 01.10.2019 12:00 nmillsap11
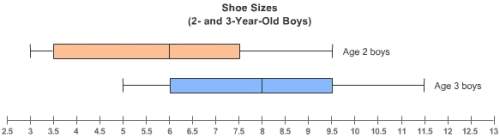
The graph compares shoe sizes for a group of 100 two-year-old boys and a
group of 60 three-year-old boys.
two box and whisker plots showing shoes sizes on a number line from 2.5 to 13. the upper plot represents the group of 2 year-old boys. for this upper plot, the minimum number is 3, the maximum number is 9.5, the right side of the box is 7.5, the left side of the box is 3.5, and the bar in the box is at 6. the lower plot represents the group of 3 year-old boys. for this lower plot, the minimum number is 5, the maximum number is 11.5, the right side of the box is 9.5, the left side of the box is 6.5, and the bar in the box is at 8.
about how many more two-year-old boys have a shoe size of 6 or less, compared to the three-year-old boys?
the salaries of six bank employees are $37,000, $38,500, $35,000, $37,000, $45,000, $40,000, and $75,000.
which statement is true?
both the mean and median are appropriate measures of center.
the median is the only appropriate measure of center.
both the median and mode are appropriate measures of center.
the mean, median, and mode are all appropriate measures of center.
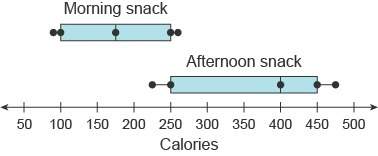
george made the box plots to compare the number of calories between his morning snacks and his afternoon snacks.
select from the drop-down menu to correctly complete the statement.
george’s typical afternoon snack has about more calories than his typical morning snack.
two boxes are plot on a horizontal axis labeled as calories ranges from 50 to 500 in increments of 50. the top box plot ranges from 90 to 260. the first line of the top box ranges from 90 to 100. the first box of the top box ranges from 100 to 175 and second box of the top box ranges from 175 to 250. the second line of the top box ranges from 250 to 260. the top box is labeled as morning snack. the bottom box plot ranges from 225 to 475. the first line of the bottom box ranges from 225 to 250. the first box of the bottom box ranges from 250 to 400 and the second box of the bottom box ranges from 400 to 450. the second line of the bottom box ranges from 450 to 475. the bottom box is labeled as afternoon snack.

Answers: 1


Another question on Mathematics
Mathematics, 21.06.2019 16:30
Mexico city, mexico, is the world's second largest metropolis and is also one of its fastest-growing cities with a projected growth rate of 3.2% per year. its population in 1991 was 20,899,000 people. use the formula p = 20.899e0.032t to predict its population p in millions with t equal to the number of years after 1991. what is the predicted population to the nearest thousand of mexico city for the year 2010?
Answers: 2
Mathematics, 21.06.2019 17:50
On a string instrument, the length of a string varies inversely as the frequency of its vibrations. an 11-inch string has a frequency of 400 cylces per second. find the frequency of a 10-icnch string.
Answers: 2
Mathematics, 21.06.2019 19:00
What numbers are included in the set of integers? what numbers are not included?
Answers: 2
Mathematics, 21.06.2019 19:00
You are at a restaurant and owe $38 for your meal. you want to leave a 20% tip. how much will your tip be?
Answers: 1
You know the right answer?
Questions


Mathematics, 06.04.2021 21:50

Mathematics, 06.04.2021 21:50

English, 06.04.2021 21:50
Mathematics, 06.04.2021 21:50

History, 06.04.2021 21:50


