
Mathematics, 04.02.2020 08:51 foodisbae45678
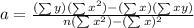
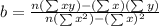
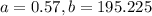
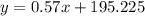
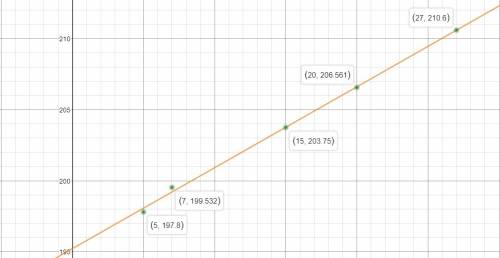
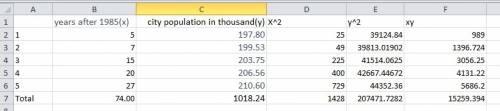
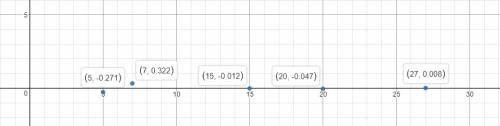
The table shows the population of center city in various years. use the data from 1990 and 2005 to create a linear model that predicts the population of the city (y) in a given year (x). in which year was the actual population of center city most different from the value predicted by this model?
year city population
1985 194,957
1990 197,800
1992 199,532
2000 203,750
2005 206,561
2012 210,600
a) 1985
b) 1992
c) 2000
d) 2012

Answers: 1


Another question on Mathematics
Mathematics, 21.06.2019 21:00
Emily is entering a bicycle race for charity. her mother pledges $0.90 for every 0.75 mile she bikes. if emily bikes 18 miles, how much will her mother donate?
Answers: 1
Mathematics, 21.06.2019 22:10
Which function can be used to model the monthly profit for x trinkets produced? f(x) = –4(x – 50)(x – 250) f(x) = (x – 50)(x – 250) f(x) = 28(x + 50)(x + 250) f(x) = (x + 50)(x + 250)
Answers: 2
Mathematics, 22.06.2019 00:00
Plz answer asap! i will reward brainliest and 12 points for these three questions!take notice: these three questions are completely different! 1) what is the percentage of sugar in the syrup made of 10 kg of water and 4 kg of suugar? 2) what was the original price if after 10% discount it became $450? 3) at first a price was decreased by 12%, then it was disounted again by an additional 5%. what is the percent of the total discount? , and remeber i will award brainliest and 12 points!
Answers: 1
Mathematics, 22.06.2019 01:00
X² + 4y² = 36 the major axis runs along: a) y=4x b) x-axis c) y-axis
Answers: 3
You know the right answer?
The table shows the population of center city in various years. use the data from 1990 and 2005 to c...
Questions

History, 30.01.2021 07:00


Physics, 30.01.2021 07:00
History, 30.01.2021 07:00
Mathematics, 30.01.2021 07:00
Mathematics, 30.01.2021 07:10
Mathematics, 30.01.2021 07:10

Social Studies, 30.01.2021 07:10

English, 30.01.2021 07:10
English, 30.01.2021 07:10

Chemistry, 30.01.2021 07:10

Geography, 30.01.2021 07:10


