

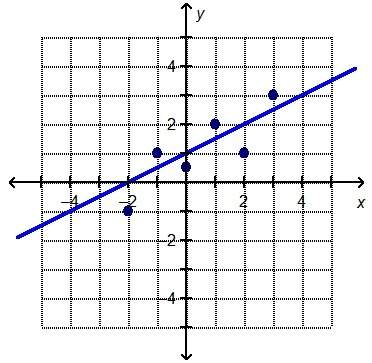
Consider the graph of the line of best fit, y = 0.5x + 1, and the given data points.
whi...

Mathematics, 11.10.2019 18:30 taylor5384
Consider the graph of the line of best fit, y = 0.5x + 1, and the given data points.
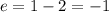
which is the residual value when x = 2?
a.–2
b.–1
c.1
d.2

Answers: 2


Another question on Mathematics
Mathematics, 21.06.2019 16:30
Data are collected to see how many ice-cream cones are sold at a ballpark in a week. day 1 is sunday and day 7 is the following saturday. use the data from the table to create a scatter plot.
Answers: 3
Mathematics, 21.06.2019 19:30
Me max recorded the heights of 500 male humans. he found that the heights were normally distributed around a mean of 177 centimeters. which statements about max’s data must be true? a) the median of max’s data is 250 b) more than half of the data points max recorded were 177 centimeters. c) a data point chosen at random is as likely to be above the mean as it is to be below the mean. d) every height within three standard deviations of the mean is equally likely to be chosen if a data point is selected at random.
Answers: 2
Mathematics, 21.06.2019 21:00
Yahir designs bracelets. he uses between 9 and 15 red and yellow beads in the ratio of 2 red bead to 5 yellow beads. drag the beads into the container to meet these requirements
Answers: 2
Mathematics, 21.06.2019 22:00
If you have 12 feet of string and you cut it into equal length of 5 inches each how much string will be left
Answers: 2
You know the right answer?
Questions

Mathematics, 15.10.2020 20:01

History, 15.10.2020 20:01


History, 15.10.2020 20:01
Mathematics, 15.10.2020 20:01
Mathematics, 15.10.2020 20:01

Mathematics, 15.10.2020 20:01

Mathematics, 15.10.2020 20:01
Health, 15.10.2020 20:01
Mathematics, 15.10.2020 20:01
Social Studies, 15.10.2020 20:01
Mathematics, 15.10.2020 20:01


