

Need with these 5 !
#1 the graph shows a journey in a car. which of the statements mos...

Mathematics, 02.11.2019 21:31 jalisabarnes12401
Need with these 5 !
#1 the graph shows a journey in a car. which of the statements most likely describes the journey at the portion of the graph labeled k?
a line graph is drawn on the first quadrant of a coordinate plane. the x axis is labeled time in seconds, and the y axis is labeled distance in miles. the line graph is divided into 7 segments labeled i, j, k, l, m, n, and o. i starts at the origin and is a straight line slanting up. j is a line segment that starts at the end of i and is horizontal. k is a curve that starts at the end of j and curves up. l is a straight line that starts at the end of k and is horizontal. m is a straight line that starts at the end of l and slopes down. n is a straight line that starts at the end of m and is horizontal. o is a curve that starts at the end of n and curves down to finally touch the x axis.
the car travels the same distance per unit of time because the portion shows a linear, increasing function.
the car travels different distances per unit of time because the portion shows a linear, increasing function.
the car travels different distances per unit of time because the portion shows a nonlinear, increasing function.
the car travels the same distance per unit of time because the portion shows a nonlinear, increasing function.
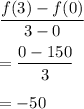
#2 he graph below plots a function f(x):
graph of line segment going through ordered pairs 0,150 and 3, 0
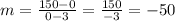
if x represents time, the average rate of change of the function f(x) in the first three seconds is
#3 the tables below show the values of y corresponding to different values of x:
table a
x 3 3 2
y 1 0 0
table b
x 3 5 5
y −2 2 −2
which statement is true for the tables?
both table a and table b represent functions.
both table a and table b do not represent functions.
table a does not represent a function, but table b represents a function.
table a represents a function, but table b does not represent a function.
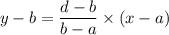
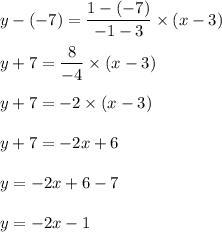
#4 what is the slope of the line that passes through (3, −7) and (−1, 1)?
undefined
0
−2
2
#5 state the domain of the relation.
discrete graph defined on the set of points negative two comma negative four and zero comma zero and positive one comma positive one and positive two comma positive two and positive three comma positive one and positive four comma positive six.
{−2, 0, 1, 2, 3, 4}
{−4, 0, 1, 2, 6}
{0, 1, 2, 3}
{−2, 4}

Answers: 3


Another question on Mathematics
Mathematics, 21.06.2019 14:00
Describe the symmetry of the figure. identify lines of symmetry, if any. find the angle and the order of any rotational symmetry.
Answers: 2
Mathematics, 21.06.2019 17:20
Read the situations in the table below. then drag a graph and equation to represent each situation. indicate whether each of the relationships is proportional or non-proportional. edit : i got the right answer its attached
Answers: 2
Mathematics, 21.06.2019 19:00
Find the y-intercept and x-intercept for the equation 5x-3y=60 what is the y-intercept
Answers: 1
Mathematics, 21.06.2019 20:00
Pepe and leo deposits money into their savings account at the end of the month the table shows the account balances. if there pattern of savings continue and neither earns interest nor withdraw any of the money , how will the balance compare after a very long time ?
Answers: 1
You know the right answer?
Questions

Biology, 10.10.2019 22:30

Physics, 10.10.2019 22:30

History, 10.10.2019 22:30

Mathematics, 10.10.2019 22:30
English, 10.10.2019 22:30
History, 10.10.2019 22:30
Mathematics, 10.10.2019 22:30

Mathematics, 10.10.2019 22:30
Mathematics, 10.10.2019 22:30
Chemistry, 10.10.2019 22:30
Mathematics, 10.10.2019 22:30


