
Mathematics, 26.11.2019 20:31 jessicaaaamartin
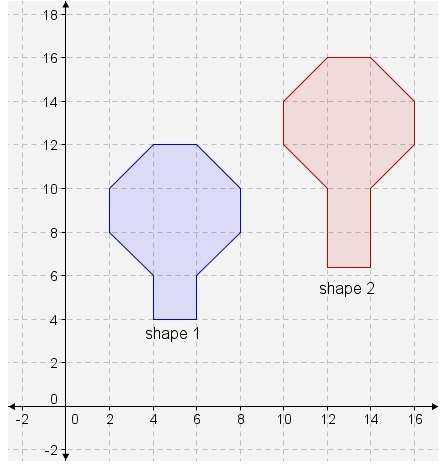
Shape 1 and shape 2 are plotted on a coordinate plane. which statement about the shapes is true?
shape 1 is congruent to shape 2, which can be shown using a sequence of dilations and translations.
shape 1 is not congruent to shape 2 because the shapes do not have the same absolute coordinates.
shape 1 is congruent to shape 2, which can be shown using a translation.
shape 1 is not congruent to shape 2 because a sequence of rigid transformations will not map shape 1 onto shape 2.

Answers: 3


Another question on Mathematics
Mathematics, 21.06.2019 18:30
Astuntman jumping off a 20-m-high building is modeled by the equation h=20-5t^2, where t is the same in seconds. a high-speed camera is ready to film him between 15m and 10m above the ground. for which interval of time should the camera film him?
Answers: 1
Mathematics, 21.06.2019 19:30
1. are the corresponding angles congruent 2. find the ratios of the corresponding sides 3. is triangle jkl congruent to triangle rst? if so what is the scale factor
Answers: 1
Mathematics, 22.06.2019 00:00
The amount cami raised during last year’s charity walk, $45.50, is 7/10 of the amount she raised this year. which equation represents n, the number of dollars she raised this year?
Answers: 2
Mathematics, 22.06.2019 02:00
1. the manager of collins import autos believes the number of cars sold in a day (q) depends on two factors: (1) the number of hours the dealership is open (h) and (2) the number of salespersons working that day (s). after collecting data for two months (53 days), the manager estimates the following log-linear model: q 4 equation 1 a. explain, how to transform the log-linear model into linear form that can be estimated using multiple regression analysis. the computer output for the multiple regression analysis is shown below: q4 table b. how do you interpret coefficients b and c? if the dealership increases the number of salespersons by 20%, what will be the percentage increase in daily sales? c. test the overall model for statistical significance at the 5% significance level. d. what percent of the total variation in daily auto sales is explained by this equation? what could you suggest to increase this percentage? e. test the intercept for statistical significance at the 5% level of significance. if h and s both equal 0, are sales expected to be 0? explain why or why not? f. test the estimated coefficient b for statistical significance. if the dealership decreases its hours of operation by 10%, what is the expected impact on daily sales?
Answers: 2
You know the right answer?
Shape 1 and shape 2 are plotted on a coordinate plane. which statement about the shapes is true?
Questions

English, 19.05.2020 17:57


Mathematics, 19.05.2020 17:57
Mathematics, 19.05.2020 17:57

Mathematics, 19.05.2020 17:57

Advanced Placement (AP), 19.05.2020 17:57

Mathematics, 19.05.2020 17:57
Biology, 19.05.2020 17:57


