Mathematics, 18.04.2021 04:00 kioxio69
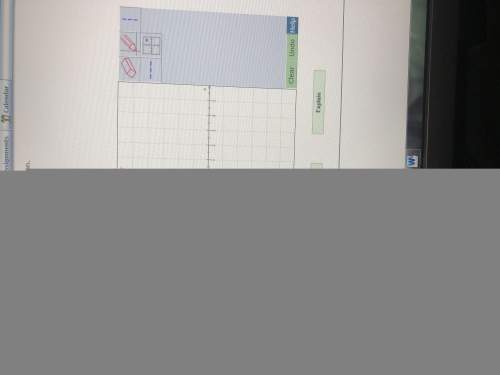
The graph illustrates the distribution of test scores taken by College Algebra students. The maximum possible score on the test was 110, while the mean score was 71 and the standard deviation was 8.
47,55,63,71,79,87,95
Use the 68-95-99.7 Rule (Empirical Rule), not a calculator or other technology, to answer the following.
What is the approximate percentage of students who scored less than 55 on the test?
%
What is the approximate percentage of students who scored between 71 and 79 on the test?
%
What is the approximate percentage of students who scored between 55 and 87 on the test?
%
What is the approximate percentage students who scored between 63 and 79 on the test?
%

Answers: 1


Another question on Mathematics


Mathematics, 21.06.2019 13:20
Given f(x) = 10x + 4 and g(x) = 3x - 8, what is f(x) + g(x) ? - 7x - 4 - 13x + 4 - 7x + 4 - 13x - 4
Answers: 2

Mathematics, 21.06.2019 13:30
What is the nth term rule of the linear sequence below? 27 , 25 , 23 , 21 , 19 , . .
Answers: 1

Mathematics, 21.06.2019 17:00
Describe what moves you could use to create the transformation of the original image shown at right
Answers: 1
You know the right answer?
The graph illustrates the distribution of test scores taken by College Algebra students. The maximum...
Questions

Mathematics, 01.03.2021 23:40


English, 01.03.2021 23:40


Chemistry, 01.03.2021 23:40


History, 01.03.2021 23:40


Mathematics, 01.03.2021 23:40


Chemistry, 01.03.2021 23:40


