37
Entry Ticket
The dot plot shows the number of touchdowns a football team scored in 10 game...

Mathematics, 16.04.2021 22:20 mikisims
37
Entry Ticket
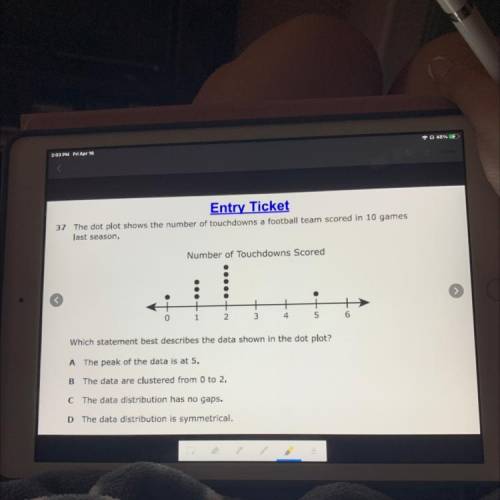
The dot plot shows the number of touchdowns a football team scored in 10 games
last season,
Number of Touchdowns Scored
0
1
2.
3
4
5
6
Which statement best describes the data shown in the dot plot?
A The peak of the data is at 5.
B The data are clustered from 0 to 2,
C The data distribution has no gaps.
D The data distribution is symmetrical.

Answers: 1


Another question on Mathematics
Mathematics, 21.06.2019 14:00
6people equally share 56 gummy worms. how many gummy worms does each person get? nine and one sixth gummy worms nine and two sixths gummy worms ten and one sixth gummy worms ten and two eighths gummy worms
Answers: 1
Mathematics, 21.06.2019 14:30
Geometry: determine whether segment mn is parallel to segment kl. justify your answer. jm 6 mk 3 jn 8 nl 4
Answers: 3
Mathematics, 21.06.2019 14:40
Sara sells beaded necklaces she makes a profit of 4 dollars pn every neclace she sells which table represents the profit sara makes
Answers: 1
Mathematics, 21.06.2019 15:40
Use properties to rewrite the given equation. which equations have the same solution as 2.3p – 10.1 = 6.5p – 4 – 0.01p?
Answers: 2
You know the right answer?
Questions


Mathematics, 30.09.2020 02:01

History, 30.09.2020 02:01
History, 30.09.2020 02:01
Mathematics, 30.09.2020 02:01

Advanced Placement (AP), 30.09.2020 02:01

Mathematics, 30.09.2020 02:01
Mathematics, 30.09.2020 02:01
Social Studies, 30.09.2020 02:01

Geography, 30.09.2020 02:01


