
Mathematics, 13.04.2021 16:30 yeinp9353
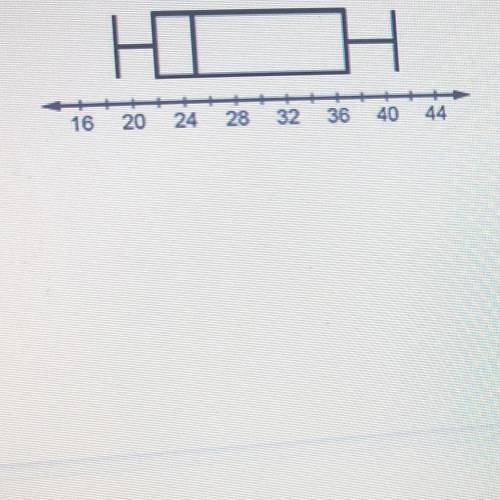
The box plot summarizes the data for the number of minutes it took to serve
customers at a restaurant.
16
20
24
28
32
36
40
44
Use the box plot to complete each statement.
1. What is the shortest time it took to serve a customer?
Write your answer in the space below.

Answers: 2


Another question on Mathematics
Mathematics, 21.06.2019 16:10
In a sample of 200 residents of georgetown county, 120 reported they believed the county real estate taxes were too high. develop a 95 percent confidence interval for the proportion of residents who believe the tax rate is too high. (round your answers to 3 decimal places.) confidence interval for the proportion of residents is up to . would it be reasonable to conclude that the majority of the taxpayers feel that the taxes are too high?
Answers: 3
Mathematics, 21.06.2019 19:50
Organic apples are on special for $1.50 per pound. does total cost vary inversely or directly with the number of pounds purchased? find the cost of 3.4 pounds of apples. a. inversely: $5.10 b. directly; $5.10 c. inversely: $2.27 d. directly; $2.27
Answers: 1
Mathematics, 21.06.2019 22:00
After a dreary day of rain, the sun peeks through the clouds and a rainbow forms. you notice the rainbow is the shape of a parabola. the equation for this parabola is y = -x2 + 36. graph of a parabola opening down at the vertex 0 comma 36 crossing the x–axis at negative 6 comma 0 and 6 comma 0. in the distance, an airplane is taking off. as it ascends during take-off, it makes a slanted line that cuts through the rainbow at two points. create a table of at least four values for the function that includes two points of intersection between the airplane and the rainbow. analyze the two functions. answer the following reflection questions in complete sentences. what is the domain and range of the rainbow? explain what the domain and range represent. do all of the values make sense in this situation? why or why not? what are the x- and y-intercepts of the rainbow? explain what each intercept represents. is the linear function you created with your table positive or negative? explain. what are the solutions or solution to the system of equations created? explain what it or they represent. create your own piecewise function with at least two functions. explain, using complete sentences, the steps for graphing the function. graph the function by hand or using a graphing software of your choice (remember to submit the graph).
Answers: 2
You know the right answer?
The box plot summarizes the data for the number of minutes it took to serve
customers at a restaura...
Questions

History, 15.12.2020 03:00


Social Studies, 15.12.2020 03:00

World Languages, 15.12.2020 03:00
Mathematics, 15.12.2020 03:00
Mathematics, 15.12.2020 03:00
Mathematics, 15.12.2020 03:00
Mathematics, 15.12.2020 03:00
Mathematics, 15.12.2020 03:00


Geography, 15.12.2020 03:00


