Which values should you plot to show a linear relationship?
Month Population
Log(population)<...

Mathematics, 13.04.2021 03:10 juniorgutierrez997
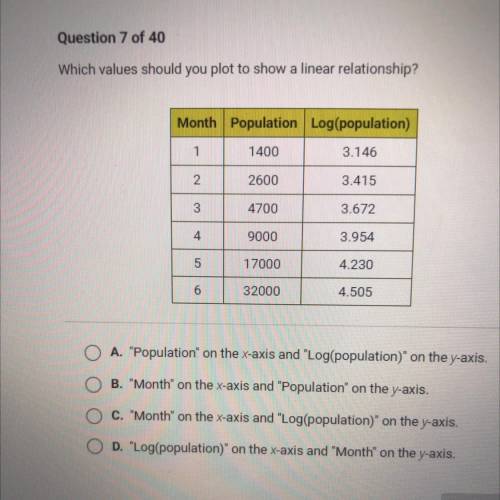
Which values should you plot to show a linear relationship?
Month Population
Log(population)
1
1400
3.146
2
2600
3.415
3
4700
3.672
4
9000
3.954
5
17000
4.230
6
32000
4.505
O A. "Population on the x-axis and "Log(population)" on the y-axis.
O B. "Month" on the x-axis and "Population" on the y-axis.
w
O C. "Month" on the x-axis and "Log(population)" on the y-axis.
O D. "Log(population)" on the x-axis and "Month" on the y-axis.

Answers: 2


Another question on Mathematics
Mathematics, 21.06.2019 18:10
Which of these sequences is a geometric sequence a 1,2,4, 7, 11, 16, 22. b. 2.4.8.14.22.38 c.3.6.9. 15.18,21 d. 3,9,27,81,243,729,
Answers: 1
Mathematics, 21.06.2019 19:50
If the scale factor between two circles is 2x/5y what is the ratio of their areas?
Answers: 3
Mathematics, 21.06.2019 20:20
Drag the tiles to the correct boxes to complete the pairs. not all tiles will be used. identify the domain for each of the given functions.
Answers: 1
You know the right answer?
Questions
Mathematics, 18.02.2021 21:20


Mathematics, 18.02.2021 21:20
Mathematics, 18.02.2021 21:20

Computers and Technology, 18.02.2021 21:20


English, 18.02.2021 21:20
Mathematics, 18.02.2021 21:20
Computers and Technology, 18.02.2021 21:20

Biology, 18.02.2021 21:20
Mathematics, 18.02.2021 21:20


