
Mathematics, 10.04.2021 23:40 emilyturchon
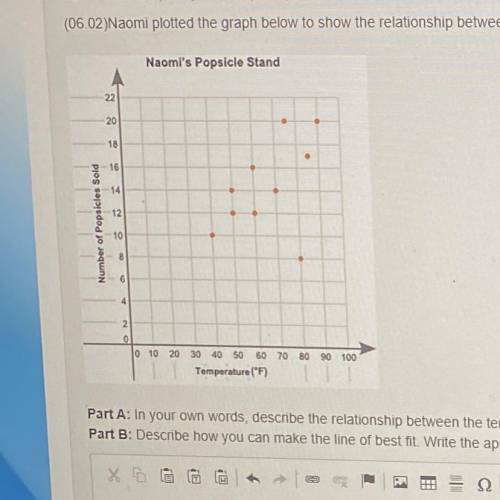
Naomi plotted the graph below to show the relationship between the temperature of her city and the number of popsicles she sold daily
Naomi's Popsicle Stand
2
1."
Part A in your own words, describe the relationship between the temperature of the city and the number of popsicles sold. (2 points)
Part B: Describe how you can make the ine of best wise the approximate skope and y tercept of the line of best t show your work, including the points that you use to calculate the slope and y-intercept. I only need B

Answers: 2


Another question on Mathematics
Mathematics, 21.06.2019 17:30
Haley buys 9 pounds of apples for $3. how many pounds of apples can she buy for $1?
Answers: 1
Mathematics, 21.06.2019 20:00
Segment an is an altitude of right δabc with a right angle at a. if ab = 2, squared 5 in and nc = 1 in, find bn, an, ac.
Answers: 2
Mathematics, 22.06.2019 03:00
In the figure, triangle aob and triangle boc form a linear pair ,find the measure of x
Answers: 3
You know the right answer?
Naomi plotted the graph below to show the relationship between the temperature of her city and the n...
Questions


History, 21.04.2021 16:50


Arts, 21.04.2021 16:50

Spanish, 21.04.2021 16:50
History, 21.04.2021 16:50
Spanish, 21.04.2021 16:50

Mathematics, 21.04.2021 16:50
Mathematics, 21.04.2021 16:50

English, 21.04.2021 16:50

Biology, 21.04.2021 16:50


