
Mathematics, 07.04.2021 19:40 keatonjarvis
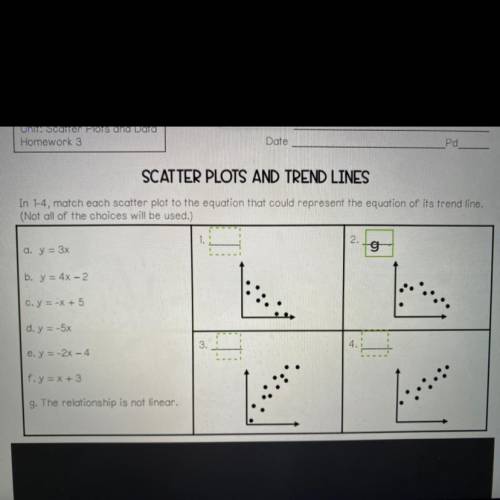
SCATTER PLOTS AND TREND LINES
In 1-4, match each scatter plot to the equation that could represent the equation of its trend line.
(Not all of the choices will be used.)
1.
2.
a. y = 3x
b. y = 4x - 2
c. y = -x + 5
d. y = -5x
3.
4.
e. y = -2x - 4
f. y = x + 3
g. The relationship is not linear.
Due today .

Answers: 2


Another question on Mathematics
Mathematics, 21.06.2019 12:50
What constants do you need to add to each of the following quadratic equations to complete the square? 2x2 - 3x = 0 x2 - 8x = 0 2x2 - 11x = 18
Answers: 1
Mathematics, 21.06.2019 21:00
Rewrite the following quadratic functions in intercept or factored form. show your work. f(x) = 3x^2 - 12
Answers: 1
Mathematics, 21.06.2019 22:00
Rick is driving to his uncles house in greenville,which is 120 miles from ricks town .after covering x miles rick she's a sign stating that greensville is 20 miles away. which equation when solved will give the value of x. a: x+120 = 20 b: x x120 =20 c: x +20 equals 120 d: x x20= 120
Answers: 3
You know the right answer?
SCATTER PLOTS AND TREND LINES
In 1-4, match each scatter plot to the equation that could represent...
Questions

SAT, 08.12.2020 21:50

Computers and Technology, 08.12.2020 21:50

Business, 08.12.2020 21:50

History, 08.12.2020 21:50
English, 08.12.2020 21:50
Mathematics, 08.12.2020 21:50

Biology, 08.12.2020 21:50
Mathematics, 08.12.2020 21:50
Mathematics, 08.12.2020 21:50
English, 08.12.2020 21:50
Mathematics, 08.12.2020 21:50
History, 08.12.2020 21:50

Health, 08.12.2020 21:50

Mathematics, 08.12.2020 21:50


