
Mathematics, 07.04.2021 16:00 yungking1329
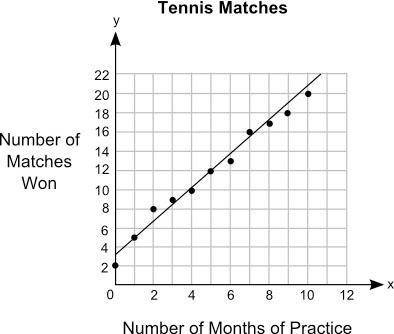
The graph shows the relationship between the number of months different students practiced tennis and the number of matches they won:
The title of the graph is Tennis Matches. On x axis, the label is Number of Months of Practice. On y axis, the label is Number of Matches Won. The scale on the y axis is from 0 to 22 at increments of 2, and the scale on the x axis is from 0 to 12 at increments of 2. The points plotted on the graph are the ordered pairs 0, 2 and 1, 5 and 2, 8 and 3, 9 and 4, 10 and 5, 12 and 6, 13 and 7, 16 and 8,17 and 9, 18 and 10,20. A straight line is drawn joining the ordered pairs 0, 3.3 and 2, 6.8 and 4, 10 and 6, 13.5 and 8, 17 and 10, 20.5.
Part A: What is the approximate y-intercept of the line of best fit and what does it represent? (5 points)
Part B: Write the equation for the line of best fit in the slope-intercept form and use it to predict the number of matches that could be won after 13 months of practice Show your work and include the points used to calculate the slope. (5 points)

Answers: 3


Another question on Mathematics
Mathematics, 21.06.2019 20:00
Leslie started last week with $1200 in her checking account. during the week, she wrote the checks below.
Answers: 1
Mathematics, 21.06.2019 20:30
Clarence wants to buy a new car. he finds an ad for a car that costs 27,200 dollars. suppose his local sales tax is 7%. -how much would he have to pay? -what is the cost of the car including tax? -if clarence has 29,864 saved, can he pay cash to buy the car?
Answers: 1
Mathematics, 21.06.2019 21:30
Consider circle c with angle acb measuring 3/4 radians.if minor arc ab measures 9 inches, what is the length of the radius of circle c? if necessary, round your answer to the nearest inch.
Answers: 2
You know the right answer?
The graph shows the relationship between the number of months different students practiced tennis an...
Questions

Mathematics, 25.07.2019 00:30


