
Mathematics, 07.04.2021 15:40 kikipie8504
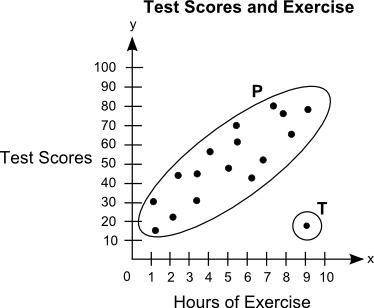
The scatter plot shows the relationship between the test scores of a group of students and the number of hours they exercise in a week:
On a grid, Label Hours of Exercise on x axis and Test Scores on y axis. The title of the graph is Test Scores and Exercise. The scale on the x axis shows the numbers from 0 to 10 at increments of 1, and the scale on the y axis shows numbers from 0 to 100 at increments of 10. Dots are made at the ordered pairs 1.1, 12 and 1, 30 and 2.1, 21 and 2.5, 42 and 3.5, 30 and 3.5, 45 and 4, 55 and 5, 45 and 5.5, 60 and 5.5, 70 and 6.5, 40 and 7, 50 and 7.5, 80 and 8, 75, and 8.5, 60 and 9, 75. The ordered pair 9, 15 is circled and labeled as T. All the other points are put in an oval and labeled as P
.
Part A: What is the group of points labeled P called? What is the point labeled T called? Give a possible reason for the presence of point T. (5 points)
Part B: Describe the association between students' test scores and the number of hours they exercise. (5 points)

Answers: 2


Another question on Mathematics
Mathematics, 21.06.2019 13:00
Which measurement is the most precise? a) 29 cm b) 28.8 cm eliminate c) 28.76 cm d) 28.762 cm
Answers: 2
Mathematics, 21.06.2019 16:30
Asequence {an} is defined recursively, with a1 = 1, a2 = 2 and, for n > 2, an = an-1 an-2 . find the term a241
Answers: 2
Mathematics, 21.06.2019 17:00
This figure consists of a rectangle and semicircle. what is the perimeter of this figure use 3.14 for pi 60.84m 72.84m 79.68m 98.52m
Answers: 2
Mathematics, 21.06.2019 17:00
Steve wants to develop a way to find the total cost of any item including sales tax. the sales tax in his city is 6%. his friend jenna writes the expression x + 6x where x is the cost of the item. explain whether her expression is correct based on the situation.
Answers: 1
You know the right answer?
The scatter plot shows the relationship between the test scores of a group of students and the numbe...
Questions


Mathematics, 06.07.2019 08:50

English, 06.07.2019 08:50

Physics, 06.07.2019 08:50
Physics, 06.07.2019 08:50

Chemistry, 06.07.2019 08:50

Social Studies, 06.07.2019 08:50

English, 06.07.2019 08:50
Mathematics, 06.07.2019 08:50


