
Mathematics, 07.04.2021 07:20 okitsfrizz2323
Pls help thank you :)
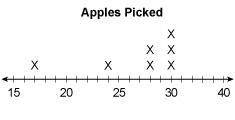
The dot plot represents the number of apples picked by a family. Explain how the outlier of the data affects the statistical summary of the data.
Select the answers from the drop-down menus to complete the statements.
The mean apples picked
increases or decreases or does not change?
because of the outlier.
The median apples picked
increases or decreases or does not change?
because of the outlier.
The range
increases or decreases or does not change?
because of the outlier.

Answers: 2


Another question on Mathematics
Mathematics, 21.06.2019 18:30
Una caja de galletas contiene 16 paquetes y cada una de estas tiene 12 galletas y se quieren repartir entre 6 niños ¿de cuantas galletas le toca a cada niño?
Answers: 1
Mathematics, 21.06.2019 20:30
Write an expression that represent sarah’s total pay last week.represent her hourly wage with w monday 5 tuesday 3 wednesday 0 noah hours wednesday 8 only with w wage did noah and sarah earn the same amount last week?
Answers: 3
Mathematics, 21.06.2019 21:00
Which zero pair could be added to the function f(x) = x2 + 12x + 6 so that the function can be written in vertex form? o 3, -3o 6,629,-936, 36
Answers: 3
Mathematics, 21.06.2019 23:00
Over the course of a month, a person's weight decreases. what type of relationship is this? a. positive relationship
Answers: 3
You know the right answer?
Pls help thank you :)
The dot plot represents the number of apples picked by a family. Explain how...
Questions

Biology, 04.11.2020 19:20

Health, 04.11.2020 19:20
Mathematics, 04.11.2020 19:20
Mathematics, 04.11.2020 19:20
Mathematics, 04.11.2020 19:20
Mathematics, 04.11.2020 19:20


History, 04.11.2020 19:20
Mathematics, 04.11.2020 19:20


