
Mathematics, 06.04.2021 21:00 alexisbrad3107
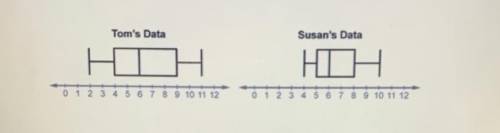
Tom and Susan park at different lots.
To see which lot is busier, they count the numbers of cars in the lots each day as they arrive. Their data are shown in the box plots.
Answer the questions to compare the variabilities of the data sets.
1. What is the interquartile range for Tom's data? Explain how you found the interquartile range.
2. What is the interquartile range for Susan's data?
3. Whose data are more variable?

Answers: 2


Another question on Mathematics
Mathematics, 21.06.2019 17:50
Segment ab is shown on the graph. which shows how to find the x-coordinate of the point that will divide ab into a 2: 3 ratio using the formula
Answers: 2
Mathematics, 21.06.2019 18:30
The clayton family’s pool has vertices at the coordinates (0, 2), (0, 5), (2, 5), (2, 6), (5, 6), (5, 1), (2, 1), and (2, 2). if each grid square has an area of 9 square feet, what is the area of the pool?
Answers: 1
Mathematics, 21.06.2019 23:50
The height of a plant, in inches, p years after planting it is given by the polynomial function r(p) = -2p% + 270p. find the height of the plant when p = 90 years.
Answers: 3
You know the right answer?
Tom and Susan park at different lots.
To see which lot is busier, they count the numbers of cars in...
Questions

Chemistry, 31.03.2020 19:36


Mathematics, 31.03.2020 19:36
Mathematics, 31.03.2020 19:36

Social Studies, 31.03.2020 19:36
Mathematics, 31.03.2020 19:36
SAT, 31.03.2020 19:36
Mathematics, 31.03.2020 19:36
Mathematics, 31.03.2020 19:36


