
Mathematics, 05.04.2021 18:20 rlumanlan549
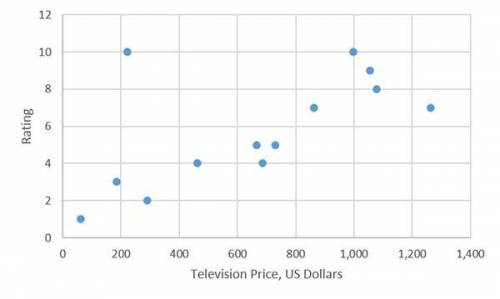
The cost and customer rating of 13 televisions is shown on the scatterplot. The televisions are rated on a scale of 0 to 10.
Scatterplot with x axis labeled Television Price going from 0 to 1,400 and y axis labeled Rating going from 0 to 12. Values at 61, 1; 185, 3; 221, 10; 291, 2; 462, 4; 666, 5; 686, 4; 730, 5; 862, 7; 997, 10; 1,055, 9; 1,077, 8; 1,263, 7.
Part A: Describe the association shown in the scatterplot. (4 points).
Part B: Give an example of a data point that affects the appropriateness of using a linear regression model to fit all the data. Explain. (4 points)
Part C: Give an example of a television that is cost effective and rated highly by customers. (2 points)

Answers: 2


Another question on Mathematics
Mathematics, 21.06.2019 14:10
What is the slope of the line that contains the points (4,8) and (9,8)? what type of line is it?
Answers: 2
Mathematics, 21.06.2019 17:00
Find an equation for the linear function which has slope -10 and x-intercept -7
Answers: 1
You know the right answer?
The cost and customer rating of 13 televisions is shown on the scatterplot. The televisions are rate...
Questions


Social Studies, 02.10.2020 21:01

Mathematics, 02.10.2020 21:01
Social Studies, 02.10.2020 21:01
Spanish, 02.10.2020 21:01

Mathematics, 02.10.2020 21:01


