
Mathematics, 05.04.2021 01:50 ptrlvn01
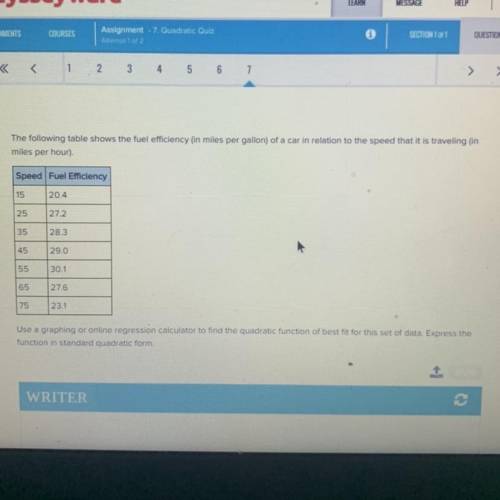
The following table shows the fuel efficiency (in miles per gallon) of a car in relation to the speed that it is traveling (in
miles per hour).
Speed Fuel Efficiency
15
20.4
25
27.2
35
28.3
45
29.0
55
30.1
65
27.6
75
23.1
Use a graphing or online regression calculator to find the quadratic function of best fit for this set of data. Express the
function in standard quadratic form.

Answers: 2


Another question on Mathematics
Mathematics, 21.06.2019 16:30
Write each fraction as an equivalent fraction with a denominator of 120then write the original fractions in order from samllest to largest
Answers: 3
You know the right answer?
The following table shows the fuel efficiency (in miles per gallon) of a car in relation to the spee...
Questions


Mathematics, 14.02.2020 04:29


Computers and Technology, 14.02.2020 04:29


Mathematics, 14.02.2020 04:29
Mathematics, 14.02.2020 04:29
Mathematics, 14.02.2020 04:29


