subject
Mathematics, 02.04.2021 19:30 shy5732

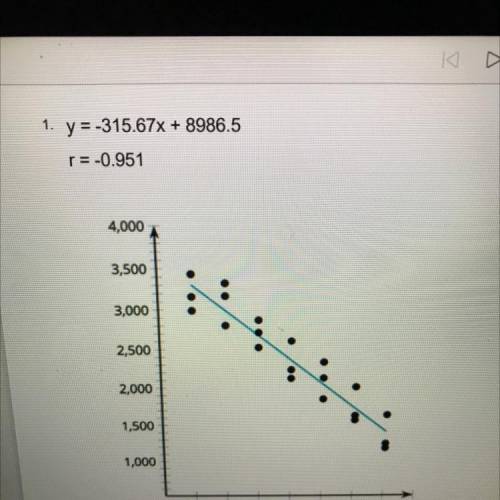
1. y 315.67% + 8986.5 -0.951
4.000
3.500
.
3.000
2.500
2.000
1.500
1.000
18 19 20 21 22 23 24 25
Twenty-one young men got a quote for the cost of a car insurance policy. The policy cost
and ages of the men are shown in the scatter plot. Select the TWO statements that are
true based on the scatter plot.
Pick up to 2 answers
A Every 19-year-old in this group has a lower cost of car insurance than the 18-year-
olds.
B Car Insurance policy cost tends to decrease as age of the driver increases.
C. The value of the correlation coefficient is very close to -1, so there is no association
between age and car insurance policy cost.
D. The line of best fit indicates that, in general, the cost of a car insurance policy for a
21-year-old should be on average, about $315 less than the cost of a car insurance
policy for a 20-year-old
E The intercept from the line of best fit indicates that, if the linear trend holds, a car
insurance policy would be $0 for a person who is about 8,987 years old.


1. y 315.67% + 8986.5

-0.951
4.000
3.500
....
3.000
2.500
2.000
1.500
1.000
18 19 20 21 22 23 24

ansver
Answers: 1

Another question on Mathematics

question
Mathematics, 21.06.2019 18:00
What is the measure of the smallest angle in the diagram? 15 29 32 45
Answers: 2
question
Mathematics, 21.06.2019 21:40
Atransformation t : (x,y) (x-5,y +3) the image of a(2,-1) is
Answers: 1
question
Mathematics, 21.06.2019 23:30
Select the correct answer and solve for y
Answers: 2
question
Mathematics, 22.06.2019 01:00
The weight of 46 new patients of a clinic from the year 2018 are recorded and listed below. construct a frequency distribution, using 7 classes. then, draw a histogram, a frequency polygon, and an ogive for the data, using the relative information from the frequency table for each of the graphs. describe the shape of the histogram. data set: 130 192 145 97 100 122 210 132 107 95 210 128 193 208 118 196 130 178 187 240 90 126 98 194 115 212 110 225 187 133 220 218 110 104 201 120 183 124 261 270 108 160 203 210 191 180 1) complete the frequency distribution table below (add as many rows as needed): - class limits - class boundaries - midpoint - frequency - cumulative frequency 2) histogram 3) frequency polygon 4) ogive
Answers: 1
You know the right answer?
1. y 315.67% + 8986.5 -0.951
4.000
3.500
.
3.000
2.500
2.000
Questions
question
Mathematics, 11.10.2020 01:01
question
Mathematics, 11.10.2020 01:01
question
Mathematics, 11.10.2020 01:01