
Mathematics, 01.04.2021 15:30 salgadodarwin1
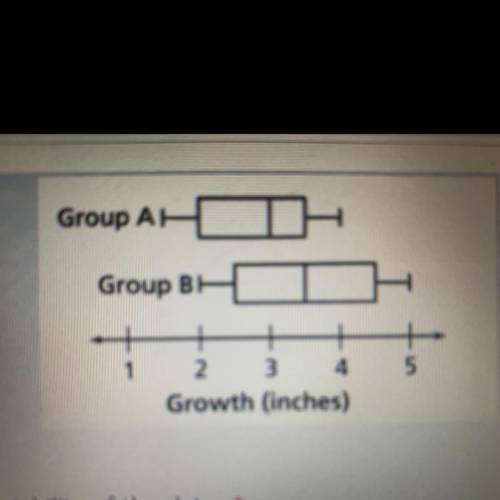
Use the box plots to make an inference using the variability of the data.
A. The range and IQR are less in Group B as compared to Group A, so there is less variability in the growth of
plants in Group B.
B. The range and IQR are less in Group B as compared to Group A, so there is greater variability in the growth of
plants in Group B.
C. The range and IQR are greater in Group B as compared to Group A, so there is less variability in the growth of
plants in Group B.
D. The range and IQR are greater in group B as compared to group a, so there is a greater variability in the growth of plants in group B

Answers: 3


Another question on Mathematics
Mathematics, 21.06.2019 17:00
Acar travels at an average speed of 52 miles per hour. how long does it take to travel 299 miles
Answers: 1
Mathematics, 21.06.2019 18:50
Which of the following values cannot be probabilities? 0.08, 5 divided by 3, startroot 2 endroot, negative 0.59, 1, 0, 1.44, 3 divided by 5 select all the values that cannot be probabilities. a. five thirds b. 1.44 c. 1 d. startroot 2 endroot e. three fifths f. 0.08 g. 0 h. negative 0.59
Answers: 2
Mathematics, 21.06.2019 23:30
Which graph represents the same relation is the sa which graph represents the same relation as the set {(-3-2)}
Answers: 3
You know the right answer?
Use the box plots to make an inference using the variability of the data.
A. The range and IQR are...
Questions


History, 16.07.2021 18:20


Chemistry, 16.07.2021 18:20
Mathematics, 16.07.2021 18:20
History, 16.07.2021 18:20

Physics, 16.07.2021 18:20
History, 16.07.2021 18:20


