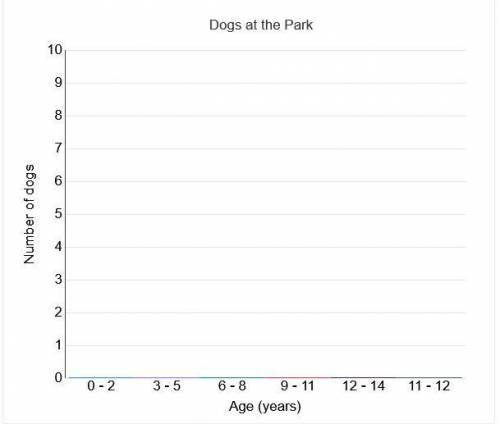
The data shows the age of eight different dogs at a dog park.
3, 3, 7, 2, 4, 8, 10, 8
C...

Mathematics, 31.03.2021 02:10 powellalyvia
The data shows the age of eight different dogs at a dog park.
3, 3, 7, 2, 4, 8, 10, 8
Create a histogram of this data.
To create a histogram, hover over each age range on the x-axis. Then click and drag up to plot the data.


Answers: 1


Another question on Mathematics

Mathematics, 21.06.2019 14:50
50 ! pls ! 12. building codes regulate the steepness of stairs. homes must have steps that are at least 13 inches wide for each 8 inches that they rise.
a. discuss how to find the slope of the stairs.
b. describe how changing the width or height affects the steepness of the stairs.
Answers: 2

Mathematics, 21.06.2019 16:30
Problem fathi wants to print out a pdf document that is 48 pages long. to save paper, he decides to print on both sides of each sheet and to print two pages on each side of the sheet. how many sheets of paper will he need?
Answers: 3

Mathematics, 21.06.2019 16:40
What is the ratio of the change in y-values to the change in x-values for this function? a) 1: 13 b) 2: 5 c) 5: 2 d) 13: 1
Answers: 3

Mathematics, 21.06.2019 18:30
Tyler enjoys the fish so much that after his birthday his family decides to take him to a famous aquarium a tank at the aquarium is similar to his tank with the scale factor of 8 how many times greater is the volume of the tank at the aquarium than the volume of tyler tank
Answers: 2
You know the right answer?
Questions


Mathematics, 02.04.2021 23:50


Mathematics, 02.04.2021 23:50


Mathematics, 02.04.2021 23:50

Mathematics, 02.04.2021 23:50


Social Studies, 02.04.2021 23:50

Computers and Technology, 02.04.2021 23:50

Mathematics, 02.04.2021 23:50


