skewed left

Mathematics, 29.03.2021 21:50 pingkeara
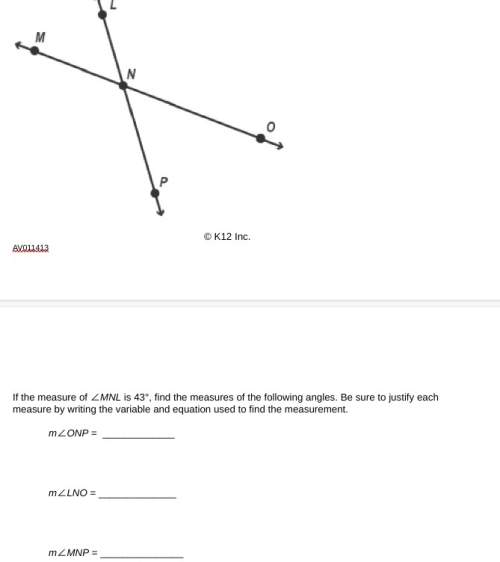
Which answer best describes the shape of this distribution?
uniform
skewed left
bell-shaped
skewed right
An untitled line plot from 35 to 49. The plot displays the following values as dots above the corresponding value on the number line. One dot at 36. One dot at 37. One dot at 38. One dot at 40. Two dots at 41. One dot at 42. Three dots at 43. Four dots at 44. Five dots at 45. Three dots at 46. Two dots at 47. One dot at 48.

Answers: 1


Another question on Mathematics


Mathematics, 21.06.2019 21:00
From the beginning of the day the temperature rose 15 degrees so that by 4 pm it was 87 degrees. what was the temperature at the start of the day
Answers: 1

Mathematics, 21.06.2019 21:30
How do your peer relationships affect your overall health status? what can you do to improve your peer relationships?
Answers: 1

Mathematics, 22.06.2019 01:30
Which point does not lie on the graph k(x) = 8 -3 √x a. (-64, 12) b. (125, 3) c. (343, 1) d. (8, 5)
Answers: 2
You know the right answer?
Which answer best describes the shape of this distribution?
uniform
skewed left
skewed left
Questions

Mathematics, 09.09.2020 18:01

Mathematics, 09.09.2020 18:01

Social Studies, 09.09.2020 18:01

Mathematics, 09.09.2020 18:01

Mathematics, 09.09.2020 18:01

Biology, 09.09.2020 18:01


Computers and Technology, 09.09.2020 18:01

Mathematics, 09.09.2020 18:01

Social Studies, 09.09.2020 18:01


