
Mathematics, 26.03.2021 20:00 layla07
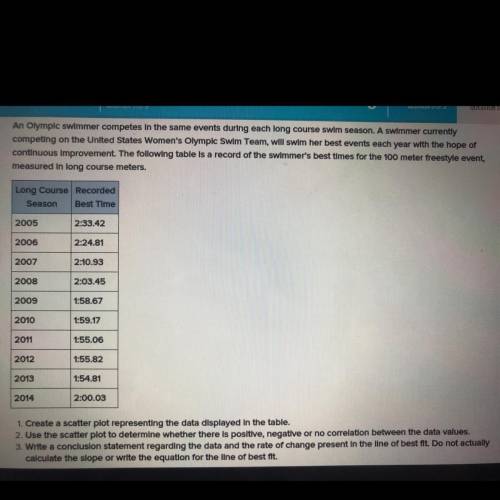
An Olympic swimmer competes in the same events during each long course swim season. A swimmer currently
competing on the United States Women's Olympic Swim Team, will swim her best events each year with the hope of
continuous Improvement. The following table is a record of the swimmer's best times for the 100 meter freestyle event,
measured In long course meters.
Long Course Recorded
Season Best Time
2005 2:33.42
2006
2:24.81
2007
2:10.93
2008
2:03.45
2009
1:58.67
2010
1:59.17
1:55.06
2011
2012
1:55.82
2013
1:54.81
2014
2:00.03
1. Create a scatter plot representing the data displayed in the table.
2. Use the scatter plot to determine whether there is positive, negative or no correlation between the data values.
3. Write a conclusion statement regarding the data and the rate of change present in the line of best fit. Do not actually
calculate the slope or write the equation for the line of best fit.
Please help me
Will give
Just give me the answer to 2 and 3
I already have 1
I just need 2 and 3
Please and thank you

Answers: 2


Another question on Mathematics
Mathematics, 21.06.2019 13:30
Apublic library wants to place 4 magazines and 9 books on each display shelf. the expressions 4s +9s represents the total number of items that will be displayed on s shelves. simplify this expression
Answers: 3
Mathematics, 21.06.2019 18:40
20 points for the brainliest? drag each tile to the correct box. not all tiles will be used. arrange the steps to solve the equation . plz
Answers: 2
You know the right answer?
An Olympic swimmer competes in the same events during each long course swim season. A swimmer curren...
Questions
Mathematics, 12.07.2019 18:00

Health, 12.07.2019 18:00


Mathematics, 12.07.2019 18:00

Mathematics, 12.07.2019 18:00


