
Mathematics, 26.03.2021 16:50 nooooooooooooooo412
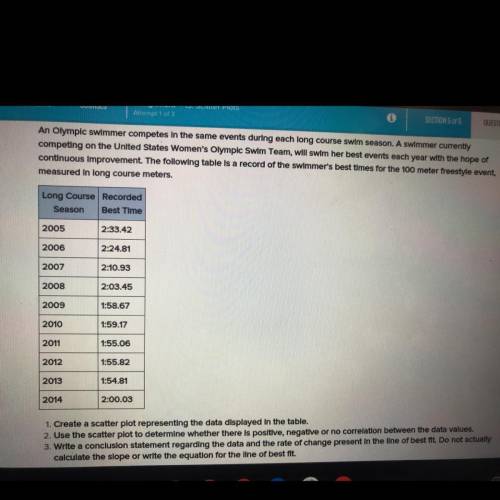
An Olympic swimmer competes in the same events during each long course swim season. A swimmer currently
competing on the United States Women's Olympic Swim Team, will swim her best events each year with the hope of
continuous Improvement. The following table is a record of the swimmer's best times for the 100 meter freestyle event,
measured in long course meters.
Long Course Recorded
Season Best Time
2005
2:33.42
2006
2:24.81
2007
2:10.93
2008
2:03.45
2009
1:58.67
2010
1:59.17
2011
1:55.06
2012
1:55.82
2013
1:54.81
2014
2:00.03
1. Create a scatter plot representing the data displayed in the table.
2. Use the scatter plot to determine whether there is positive, negative or no correlation between the data values.
3. Write a conclusion statement regarding the data and the rate of change present in the line of best fit. Do not actually
calculate the slope or write the equation for the line of best fit:
Will someone please help me
I will give you

Answers: 3


Another question on Mathematics
Mathematics, 21.06.2019 21:30
Plz hurry evaluate the expression a+b where a=8 and b=19
Answers: 1
Mathematics, 21.06.2019 22:00
Asquare and an equilateral triangle have the same perimeter. each side the triangle is 4 inches longer than each side of the square. what is the perimeter of the square
Answers: 1
Mathematics, 21.06.2019 22:30
Explain how you could use the interactive table to tell if sets of points are on the same line. math 8
Answers: 2
You know the right answer?
An Olympic swimmer competes in the same events during each long course swim season. A swimmer curren...
Questions
Mathematics, 01.07.2019 05:40

Mathematics, 01.07.2019 05:40

History, 01.07.2019 05:40
Mathematics, 01.07.2019 05:40
History, 01.07.2019 05:40
English, 01.07.2019 05:40

Biology, 01.07.2019 05:50


Social Studies, 01.07.2019 05:50
Biology, 01.07.2019 05:50
Biology, 01.07.2019 05:50
Mathematics, 01.07.2019 05:50
Biology, 01.07.2019 05:50


