Questions
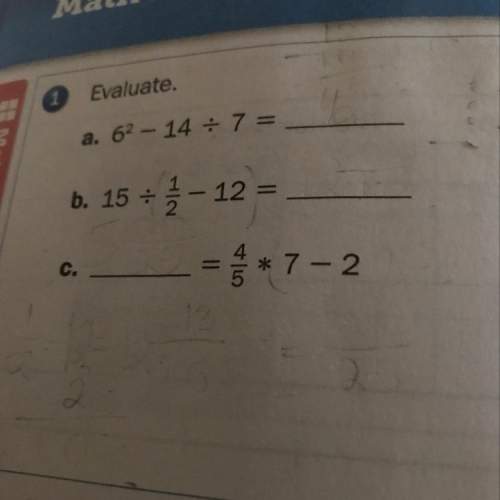
The graph below isany of the number of sold by two classes for a school tundraiser
...

Mathematics, 25.03.2021 21:40 nathansnyder200
Questions
The graph below isany of the number of sold by two classes for a school tundraiser
Items Sold
Class 2
Class 1
0
5
10
15
20
25
The teachers in each class compared their results side by side and determined that Class 1 had more variability than Class 2. Which statement BEST describes the conclusion of the teachers?
It is not true because the medians of each class is the same.
It is not true because the mamum is the same for each dass
С
tis tue because the range of Class 1 is greater than that of Class 2
D
It is true because the minimum for Class 1 is less than that of Class 2
02001 mumine Education Inc

Answers: 2


Another question on Mathematics
Mathematics, 21.06.2019 16:00
This race was first held in 1953 on august 16th. every decade the race finishes with a festival. how many years is this?
Answers: 2
Mathematics, 21.06.2019 20:00
Formulate alisha has a number in mind. if she adds three to her number the result is less than five. use this information to write and solve an inequality about alisha's number. then graph the solution set.
Answers: 1
Mathematics, 21.06.2019 20:30
Acircle has a circumference of 7.850 units. what is its radius?
Answers: 2
You know the right answer?
Questions


Computers and Technology, 30.11.2019 06:31


