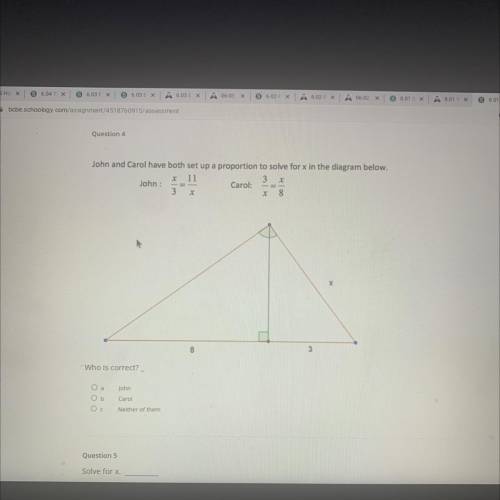
John and Carol have both set up a proportion to solve for x in the diagram below.
X 11
John:<...

Mathematics, 25.03.2021 08:10 vieraml58
John and Carol have both set up a proportion to solve for x in the diagram below.
X 11
John:
3 x
3
X 8
Carol:
x
8
3
Who is correct? _
Oь
John
Carol
Neither of them

Answers: 1


Another question on Mathematics
Mathematics, 21.06.2019 17:10
The number of chocolate chips in an 18-ounce bag of chocolate chip cookies is approximately normally distributed with a mean of 1252 chips and standard deviation 129 chips. (a) what is the probability that a randomly selected bag contains between 1100 and 1500 chocolate chips, inclusive? (b) what is the probability that a randomly selected bag contains fewer than 1125 chocolate chips? (c) what proportion of bags contains more than 1225 chocolate chips? (d) what is the percentile rank of a bag that contains 1425 chocolate chips?
Answers: 1
Mathematics, 21.06.2019 19:00
Me with geometry ! in this figure, bc is a perpendicular bisects of kj. dm is the angle bisects of bdj. what is the measure of bdm? •60° •90° •30° •45°
Answers: 2
Mathematics, 21.06.2019 21:00
List x1, x2, x3, x4 where xi is the midpoint endpoint of the five equal intervals used to estimate the area under the curve of f(x) between x = 0 and x = 10.
Answers: 1
Mathematics, 21.06.2019 21:30
Name and describe the three most important measures of central tendency. choose the correct answer below. a. the mean, sample size, and mode are the most important measures of central tendency. the mean of a data set is the sum of the observations divided by the middle value in its ordered list. the sample size of a data set is the number of observations. the mode of a data set is its highest value in its ordered list. b. the sample size, median, and mode are the most important measures of central tendency. the sample size of a data set is the difference between the highest value and lowest value in its ordered list. the median of a data set is its most frequently occurring value. the mode of a data set is sum of the observations divided by the number of observations. c. the mean, median, and mode are the most important measures of central tendency. the mean of a data set is the product of the observations divided by the number of observations. the median of a data set is the lowest value in its ordered list. the mode of a data set is its least frequently occurring value. d. the mean, median, and mode are the most important measures of central tendency. the mean of a data set is its arithmetic average. the median of a data set is the middle value in its ordered list. the mode of a data set is its most frequently occurring value.
Answers: 3
You know the right answer?
Questions


History, 02.05.2021 08:00

Social Studies, 02.05.2021 08:00
Mathematics, 02.05.2021 08:00
Engineering, 02.05.2021 08:00
Engineering, 02.05.2021 08:00

Health, 02.05.2021 08:00
History, 02.05.2021 08:00

Mathematics, 02.05.2021 08:00

Advanced Placement (AP), 02.05.2021 08:00
Social Studies, 02.05.2021 08:00
Biology, 02.05.2021 08:00
Mathematics, 02.05.2021 08:00


