
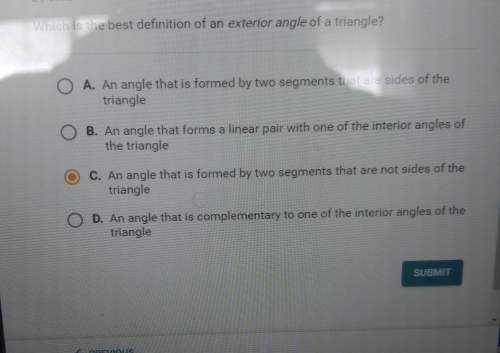
Mathematics, 24.03.2021 22:10 zaratayyibah
WILL MARK BRAINLIEST A manager is assessing the correlation between the number of employees in a plant and the number of products produced yearly. The table below shows the data: Number of employees (x) 0 25 50 75 100 125 150 175 200 Number of products (y) 10 160 310 460 610 760 910 1060 1210 Part A: Is there any correlation between the number of employees in the plant and the number of products produced yearly? Justify your answer. (4 points) Part B: Write a function which best fits the data. (3 points) Part C: What does the slope and y-intercept of the plot indicate? (3 points)

Answers: 2


Another question on Mathematics
Mathematics, 21.06.2019 21:30
Questions 9-10. use the table of educational expenditures to answer the questions. k-12 education expenditures population indiana $9.97 billion 6.6 million illinois $28.54 billion 12.9 million kentucky $6.58 billion 4.4 million michigan $16.85 billion 9.9 million ohio $20.23 billion 11.6million 9. if the amount of k-12 education expenses in indiana were proportional to those in ohio, what would have been the expected value of k-12 expenditures in indiana? (give the answer in billions rounded to the nearest hundredth) 10. use the value of k-12 education expenditures in michigan as a proportion of the population in michigan to estimate what the value of k-12 education expenses would be in illinois. a) find the expected value of k-12 expenditures in illinois if illinois were proportional to michigan. (give the answer in billions rounded to the nearest hundredth) b) how does this compare to the actual value for k-12 expenditures in illinois? (lower, higher, same? )
Answers: 1
Mathematics, 22.06.2019 02:00
Taylor graphs the system below on her graphing calculator and decides that f(x)=g(x) at x=0, x=1, and x=3. provide taylor with some feedback that explains which part of her answer is incorrect and why it is incorrect. f(x)= 2x+1 g(x)= 2x^2+1
Answers: 2
Mathematics, 22.06.2019 02:30
Atrain traveled for 1.5 hours to the first station, stopped for 30 minutes, then traveled for 4 hours to the final station where it stopped for 1 hour. the total distance traveled is a function of time. which graph most accurately represents this scenario? a graph is shown with the x-axis labeled time (in hours) and the y-axis labeled total distance (in miles). the line begins at the origin and moves upward for 1.5 hours. the line then continues upward at a slow rate until 2 hours. from 2 to 6 hours, the line continues quickly upward. from 6 to 7 hours, it moves downward until it touches the x-axis a graph is shown with the axis labeled time (in hours) and the y axis labeled total distance (in miles). a line is shown beginning at the origin. the line moves upward until 1.5 hours, then is a horizontal line until 2 hours. the line moves quickly upward again until 6 hours, and then is horizontal until 7 hours a graph is shown with the axis labeled time (in hours) and the y-axis labeled total distance (in miles). the line begins at the y-axis where y equals 125. it is horizontal until 1.5 hours, then moves downward until 2 hours where it touches the x-axis. the line moves upward until 6 hours and then moves downward until 7 hours where it touches the x-axis a graph is shown with the axis labeled time (in hours) and the y-axis labeled total distance (in miles). the line begins at y equals 125 and is horizontal for 1.5 hours. the line moves downward until 2 hours, then back up until 5.5 hours. the line is horizontal from 5.5 to 7 hours
Answers: 1
You know the right answer?
WILL MARK BRAINLIEST
A manager is assessing the correlation between the number of employees in a pl...
Questions

Health, 08.03.2021 20:00

Mathematics, 08.03.2021 20:00


History, 08.03.2021 20:00

Mathematics, 08.03.2021 20:00

Mathematics, 08.03.2021 20:00
Mathematics, 08.03.2021 20:00

Mathematics, 08.03.2021 20:00

Social Studies, 08.03.2021 20:00


