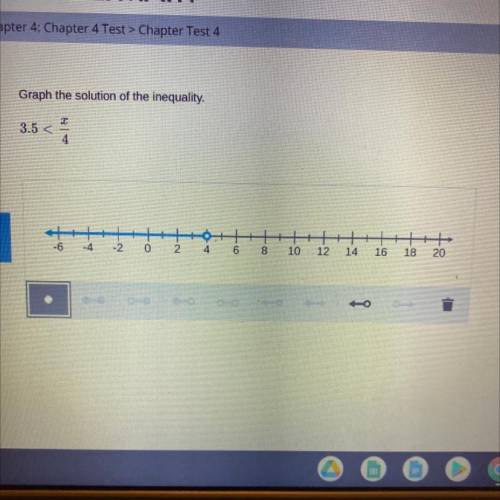
Graph the solution of the inequality.
3.5 < x/4. did i do this right?
...

Mathematics, 24.03.2021 05:00 sjsmith21
Graph the solution of the inequality.
3.5 < x/4. did i do this right?

Answers: 3


Another question on Mathematics
Mathematics, 21.06.2019 21:30
Aroulette wheel has 38 slots in which the ball can land. two of the slots are green, 18 are red, and 18 are black. the ball is equally likely to land in any slot. the roulette wheel is going to be spun twice, and the outcomes of the two spins are independent.the probability that it lands one time on red and another time on black in any order is(a) 0.5 (b) 0.25 (c) 0.4488 (d) 0.2244
Answers: 1
Mathematics, 21.06.2019 21:30
In a test for esp (extrasensory perception), the experimenter looks at cards that are hidden from the subject. each card contains either a star, a circle, a wave, a cross or a square.(five shapes) as the experimenter looks at each of 20 cards in turn, the subject names the shape on the card. when the esp study described above discovers a subject whose performance appears to be better than guessing, the study continues at greater length. the experimenter looks at many cards bearing one of five shapes (star, square, circle, wave, and cross) in an order determined by random numbers. the subject cannot see the experimenter as he looks at each card in turn, in order to avoid any possible nonverbal clues. the answers of a subject who does not have esp should be independent observations, each with probability 1/5 of success. we record 1000 attempts. which of the following assumptions must be met in order to solve this problem? it's reasonable to assume normality 0.8(1000), 0.2(1000)%30 approximately normal 0.8(1000), 0.2(1000)% 10 approximately normal srs it is reasonable to assume the total number of cards is over 10,000 it is reasonable to assume the total number of cards is over 1000
Answers: 1
Mathematics, 22.06.2019 01:20
1. why is a frequency distribution useful? it allows researchers to see the "shape" of the data. it tells researchers how often the mean occurs in a set of data. it can visually identify the mean. it ignores outliers. 2. the is defined by its mean and standard deviation alone. normal distribution frequency distribution median distribution marginal distribution 3. approximately % of the data in a given sample falls within three standard deviations of the mean if it is normally distributed. 95 68 34 99 4. a data set is said to be if the mean of the data is greater than the median of the data. normally distributed frequency distributed right-skewed left-skewed
Answers: 2
Mathematics, 22.06.2019 05:30
Write an equation of the parabola with the focus point of (0,1/3) and vertex at the origin. use x for the independent variable. explain. need !
Answers: 3
You know the right answer?
Questions


Biology, 25.11.2021 06:50

Social Studies, 25.11.2021 06:50

Chemistry, 25.11.2021 06:50
Mathematics, 25.11.2021 06:50

English, 25.11.2021 06:50
Mathematics, 25.11.2021 06:50
English, 25.11.2021 06:50
Biology, 25.11.2021 06:50


Law, 25.11.2021 06:50


