
Mathematics, 23.03.2021 06:50 18alewis
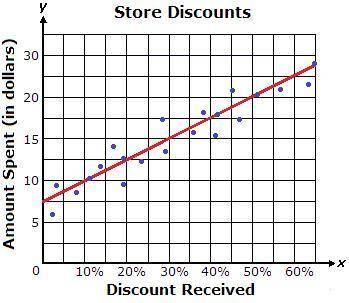
The graph below shows a line of best fit for data collected on the amount customers spent in relation to the discount they received. The equation of the line of best fit is y = 25x + 7.5. What does the y-intercept represent?
A.
the discount per item
B.
the number of items purchased
C.
the discount received by a customer who did not make a purchase
D.
the amount spent by a customer who did not receive a discount

Answers: 1


Another question on Mathematics
Mathematics, 21.06.2019 19:00
If f(x)= sqrt4x+9+2, which inequality can be used to find the domain of f(x)?
Answers: 2
Mathematics, 21.06.2019 21:30
Plz hurry evaluate the expression a+b where a=8 and b=19
Answers: 1
Mathematics, 21.06.2019 21:30
Acoffee shop orders at most $3,500 worth of coffee and tea. the shop needs to make a profit of at least $1,900 on the order. the possible combinations of coffee and tea for this order are given by this system of inequalities, where c = pounds of coffee and t = pounds of tea: 6c + 13t ≤ 3,500 3.50c + 4t ≥ 1,900 which graph's shaded region represents the possible combinations of coffee and tea for this order?
Answers: 1
You know the right answer?
The graph below shows a line of best fit for data collected on the amount customers spent in relatio...
Questions


Mathematics, 24.08.2019 00:30

English, 24.08.2019 00:30
History, 24.08.2019 00:30
English, 24.08.2019 00:30
Mathematics, 24.08.2019 00:30

Mathematics, 24.08.2019 00:30
Mathematics, 24.08.2019 00:30
Mathematics, 24.08.2019 00:30
Mathematics, 24.08.2019 00:30
Mathematics, 24.08.2019 00:30
History, 24.08.2019 00:30


