
Mathematics, 23.03.2021 04:00 ghetauto
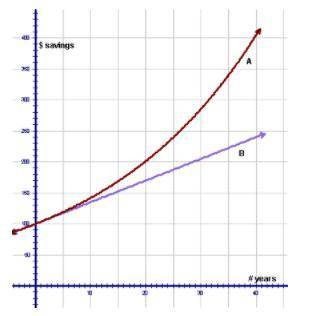
Graph A represents the amount of savings in an account compounded monthly, with a beginning principal of $100 and an interest rate of 3.5 percent.
Estimate from the graph, the amount in this account in 20 years.
$180
$190
$200
$210

Answers: 3


Another question on Mathematics
Mathematics, 21.06.2019 19:00
Write the expression in complete factored form. 5n_(c - 3) - n(c - 3) =
Answers: 2
Mathematics, 21.06.2019 22:50
1. if events a and b are non-overlapping events, how do you find the probability that one or the other occurs? 2. what does it mean if p(a or b) equals 1?
Answers: 2
Mathematics, 21.06.2019 23:00
Someone answer this asap for the function f(x) and g(x) are both quadratic functions. f(x) = x² + 2x + 5 g(x) = x² + 2x - 1 which statement best describes the graph of g(x) compared to the graph of f(x)? a. the graph of g(x) is the graph of f(x) shifted down 1 units. b. the graph of g(x) is the graph of f(x) shifted down 6 units. c. the graph of g(x) is the graph of f(x) shifted to the right 1 unit. d. the graph of g(x) is the graph of f(x) shifted tothe right 6 units.
Answers: 3
You know the right answer?
Graph A represents the amount of savings in an account compounded monthly, with a beginning principa...
Questions
Mathematics, 22.06.2020 20:57
Mathematics, 22.06.2020 20:57

Mathematics, 22.06.2020 20:57

Mathematics, 22.06.2020 20:57

History, 22.06.2020 20:57

Mathematics, 22.06.2020 20:57


Social Studies, 22.06.2020 20:57
Mathematics, 22.06.2020 20:57

Mathematics, 22.06.2020 20:57
Mathematics, 22.06.2020 20:57


