
Mathematics, 22.03.2021 06:10 goreimani9
I'm so confused help plz and thank you.
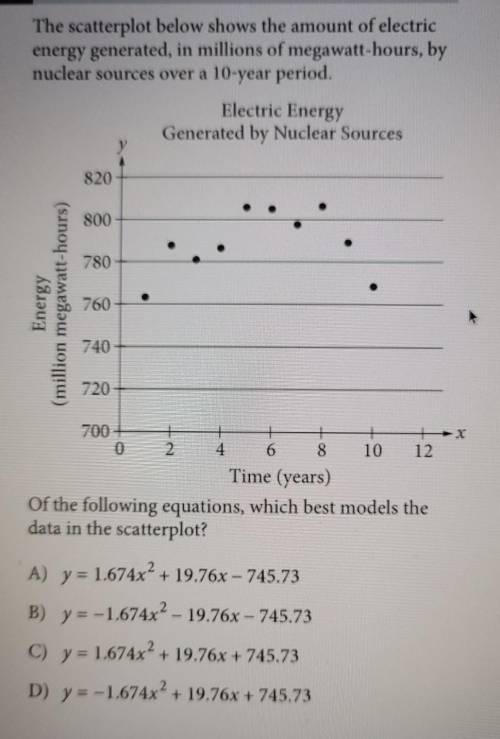
The scatterplot below shows the amount of electric energy generated, in millions of megawatt-hours, by nuclear sources over a 10-year period. Electric Energy Generated by Nuclear Sources 820 800 780 Energy (million megawatt-hours) 760 740 720 4 700 + 0 2. 6 8 10 12 Time (years) Of the following equations, which best models the data in the scatterplot? A) y = 1.674x² + 19.76x - 745.73
B) y = -1.674x2 – 19.76x - 745.73
C) y = 1.674x² + 19.76x + 745.73
D) y = -1.674x² + 19.76x + 745.73

Answers: 2


Another question on Mathematics
Mathematics, 21.06.2019 19:40
What is the slope of the line that contains the points (-2,1) and (0,-3)
Answers: 2
Mathematics, 21.06.2019 20:30
Ateacher brought a pack of 17 batteries . each calculator uses 3 batteries . how many calculator can the teacher fill with batteries
Answers: 2
Mathematics, 21.06.2019 22:00
Worth 100 points need the answers asap first row -x^2 2x^2 (x/2)^2 x^2 x is less than 2 x is greater than 2 x is less than or equal to 2 x is greater than or equal to 2 second row -5 -5/2 4 5 •2 is less than x& x is less than 4 •2 is less than or equal to x & x is less than or equal to 4 •2 is less than or equal to x& x is less than 4 •2 is less than x& x is less than or equal to 4
Answers: 1
You know the right answer?
I'm so confused help plz and thank you.
The scatterplot below shows the amount of electric energy g...
Questions

Mathematics, 22.04.2021 01:00
Health, 22.04.2021 01:00
Mathematics, 22.04.2021 01:00
Mathematics, 22.04.2021 01:00


Mathematics, 22.04.2021 01:00

English, 22.04.2021 01:00
Mathematics, 22.04.2021 01:00
Mathematics, 22.04.2021 01:00


