
Mathematics, 21.03.2021 22:50 imstupid77
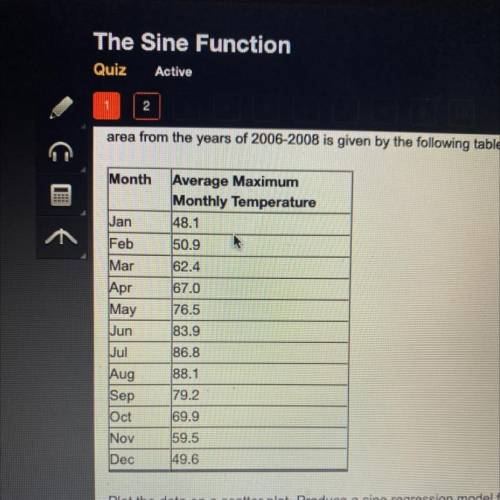
According to the National Weather Service, the average monthly high temperature in the Dallas/Fort Worth, Texas
area from the years of 2006-2008 is given by the following table:
Plot the data on a scatter plot. Produce a sine regression model for the data. Round the values for a, b, c, and d to the
nearest 0.001. Using the sine regression model predict what the temperature would be given y(30).
a. 58.4 degrees
b. 62.3 degrees
c. 76.8 degrees
d. 86.0 degrees

Answers: 1


Another question on Mathematics
Mathematics, 21.06.2019 13:00
The sketch shows two parallel lines cut by a transversal. angle 2 2 is 36° 36 ° . what is the measure of angle 8 8 ?
Answers: 1
Mathematics, 21.06.2019 13:20
Figure abcd is a parallelogram. if point c lies on the line x = 2, what is the y-value of point c?
Answers: 1
Mathematics, 21.06.2019 15:20
The data in the table represent the height of an object over time. which model best represents the data? height of an object time (seconds) height (feet) 05 1 50 2 70 3 48 quadratic, because the height of the object increases or decreases with a multiplicative rate of change quadratic, because the height increases and then decreases exponential, because the height of the object increases or decreases with a multiplicative rate of change exponential, because the height increases and then decreases
Answers: 1
Mathematics, 21.06.2019 15:30
Which triangle congruence postulate or theorem justifies my claim that the steps i made using construction paper and scissors produce an isosceles triangle? was it sss, sas, asa, aas, or hl?
Answers: 2
You know the right answer?
According to the National Weather Service, the average monthly high temperature in the Dallas/Fort W...
Questions

Mathematics, 08.09.2020 14:01


History, 08.09.2020 14:01

Mathematics, 08.09.2020 14:01
Health, 08.09.2020 14:01
History, 08.09.2020 14:01


English, 08.09.2020 14:01


