
Mathematics, 19.03.2021 06:20 alialoydd11
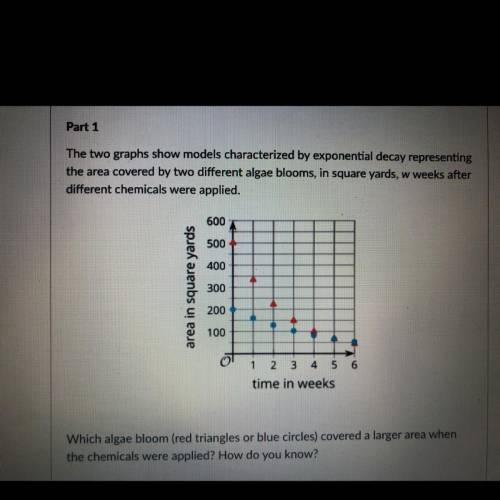
The two graphs show models characterized by exponential decay representing
the area covered by two different algae blooms, in square yards, w weeks after
different chemicals were applied.
600
A
500
400
area in square yards
300
200
100
O
1 2 3 4 5 6
time in weeks
Which algae bloom (red triangles or blue circles) covered a larger area when
the chemicals were applied? How do you know?

Answers: 2


Another question on Mathematics
Mathematics, 21.06.2019 16:50
The verbal translation for the difference of m and 7 increased by 15
Answers: 3
Mathematics, 21.06.2019 18:00
Give all possible names for the line shown.calculation tip: lines can be written with either point first.
Answers: 1
Mathematics, 21.06.2019 18:30
F(x)=x^3+4 question 6 options: the parent function is shifted up 4 units the parent function is shifted down 4 units the parent function is shifted left 4 units the parent function is shifted right 4 units
Answers: 1
You know the right answer?
The two graphs show models characterized by exponential decay representing
the area covered by two...
Questions
Mathematics, 28.06.2019 18:00


History, 28.06.2019 18:00

Chemistry, 28.06.2019 18:00
History, 28.06.2019 18:00


Geography, 28.06.2019 18:00

Chemistry, 28.06.2019 18:00


Business, 28.06.2019 18:00


Advanced Placement (AP), 28.06.2019 18:00
Business, 28.06.2019 18:00
Advanced Placement (AP), 28.06.2019 18:00


