
Mathematics, 19.03.2021 01:20 aamavizca
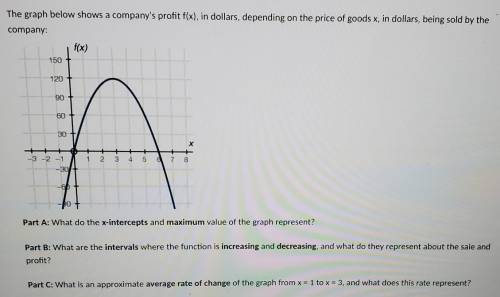
The graph below shows a company's profit f(x), in dollars, depending on the price of goods x, in dollars, being sold by the company: f(x) 150 120 90 60 30 Х 2 3 4 5 7 8 -3 -2 -1 -30 Part A: What do the x-intercepts and maximum value of the graph represent? Part B: What are the intervals where the function is increasing and decreasing, and what do they represent about the sale and profit? Part C: What is an approximate average rate of change of the graph from x = 1 to x = 3, and what does this rate represent? Init o CD

Answers: 3


Another question on Mathematics
Mathematics, 21.06.2019 18:30
Abouncy ball is released from a certain height. on the first bounce, it travels 32cm. with each subsequent bounce, it travels 9/10 the distance of the previous bounce. what is the total distance that the ball has traveled when it completes its 25th bounce?
Answers: 1
Mathematics, 21.06.2019 19:00
Angela is buying a dress that is on sale for 20% off. if the original price of the dress is $40.00, how much money is angela saving on the dress? a. $0.80 b. $3.20 c. $32.00 d. $8.00
Answers: 1
Mathematics, 21.06.2019 20:20
Sample response: if the graph passes the horizontaline test, then the function is one to one. functions that are one to one have inverses that a therefore, the inverse is a hinction compare your response to the sample response above. what did you include in your explanation? a reference to the horizontal-line test d a statement that the function is one-to-one the conclusion that the inverse is a function done
Answers: 2
Mathematics, 21.06.2019 22:00
Tom drove 206 miles in 3.9 hours. estimate his average speed.
Answers: 2
You know the right answer?
The graph below shows a company's profit f(x), in dollars, depending on the price of goods x, in dol...
Questions

Mathematics, 14.11.2019 03:31
Mathematics, 14.11.2019 03:31


Chemistry, 14.11.2019 03:31
Mathematics, 14.11.2019 03:31

Arts, 14.11.2019 03:31
English, 14.11.2019 03:31

Geography, 14.11.2019 03:31

Physics, 14.11.2019 03:31
Chemistry, 14.11.2019 03:31


