The average rainfall of a certain geographical location is modeled by the
table below.
Part A...

Mathematics, 18.03.2021 15:50 mauricestepenson791
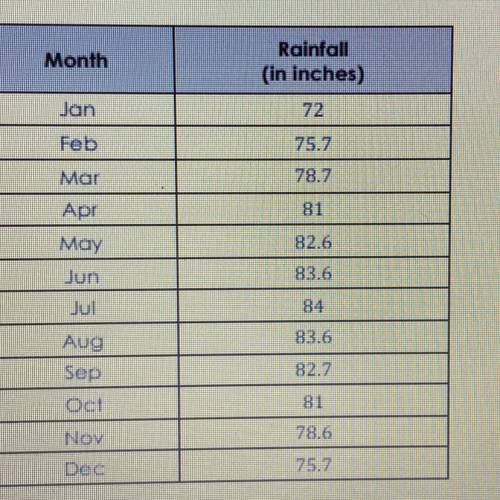
The average rainfall of a certain geographical location is modeled by the
table below.
Part A: Plot the data on the graph below if January is equivalent to x = 0.
Month
Rainfall
(in inches)
Jan
72
Feb
75.7
78.7
Mar
Apr
81
82.6
May
Jun
83.6
Jul
84
83.6
Aug
Sep
Oct
82.7
81
Nov
78.6
75.7
Dec
Part B: What type of geographical location might be represented by this
araph?

Answers: 2


Another question on Mathematics
Mathematics, 21.06.2019 18:40
Aportion of a hiking trail slopes downward at about an 84° angle. to the nearest tenth of a flot, what is the value of x, the distance the hiker traveled along the path, if he has traveled a horizontal distance of 120 feet? a. 143.3 b. 12.5 c. 120.7 d. 130.2
Answers: 1
Mathematics, 21.06.2019 22:30
What is the approximate value of q in the equation below? –1.613–1.5220.5853.079
Answers: 1
Mathematics, 21.06.2019 23:30
Solve the following: 12(x^2–x–1)+13(x^2–x–1)=25(x^2–x–1) 364x–64x=300x
Answers: 1
Mathematics, 21.06.2019 23:30
Harry the hook has 7 1/3 pounds of cookie dough.she uses 3/5 of it to bake cookie. how much cookie dough does she use to make cookie?
Answers: 1
You know the right answer?
Questions
Mathematics, 14.12.2020 06:00
Mathematics, 14.12.2020 06:00


English, 14.12.2020 06:00
Mathematics, 14.12.2020 06:00

Social Studies, 14.12.2020 06:00
History, 14.12.2020 06:00

Mathematics, 14.12.2020 06:00
Mathematics, 14.12.2020 06:00


