We will proceed to graph each case to determine the solution of the problem.
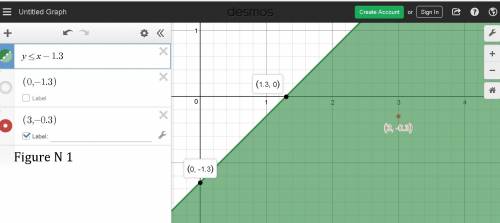
case a) ![y\leq x - 1.3](/tpl/images/0285/8188/f8277.png)
Using a graph tool
see the attached figure N ![1](/tpl/images/0285/8188/8aa3f.png)
The solution is the shaded area
The inequality of the case a) is not represented by the graph
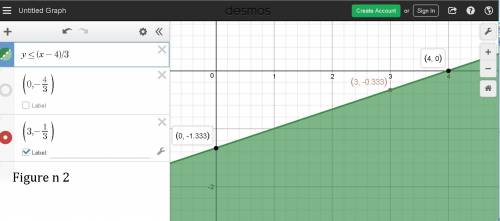
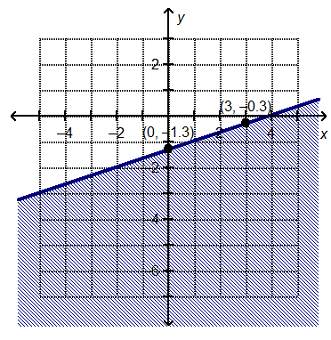
case b) ![y\leq(x - 4)/3](/tpl/images/0285/8188/f6b78.png)
Using a graph tool
see the attached figure N ![2](/tpl/images/0285/8188/05229.png)
The solution is the shaded area
The inequality of the case b) is represented by the graph
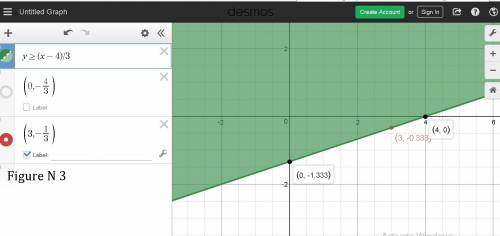
case c) ![y \geq(x -4)/3](/tpl/images/0285/8188/72a20.png)
Using a graph tool
see the attached figure N ![3](/tpl/images/0285/8188/07736.png)
The solution is the shaded area
The inequality of the case c) is not represented by the graph
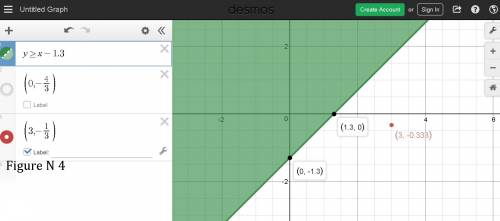
case d) ![y \geq x -1.3](/tpl/images/0285/8188/c3341.png)
Using a graph tool
see the attached figure N ![4](/tpl/images/0285/8188/ad743.png)
The solution is the shaded area
The inequality of the case d) is not represented by the graph
therefore
the answer is
The inequality
is represented by the graph
![Which linear inequality is represented by the graph? y ≤ x – 1.3 y ≤ x – 4/3 y ≥ x – 4/3 y ≥ x – 1.](/tpl/images/0285/8188/f6d8a.jpg)
![Which linear inequality is represented by the graph? y ≤ x – 1.3 y ≤ x – 4/3 y ≥ x – 4/3 y ≥ x – 1.](/tpl/images/0285/8188/3794b.jpg)
![Which linear inequality is represented by the graph? y ≤ x – 1.3 y ≤ x – 4/3 y ≥ x – 4/3 y ≥ x – 1.](/tpl/images/0285/8188/2d0a6.jpg)
![Which linear inequality is represented by the graph? y ≤ x – 1.3 y ≤ x – 4/3 y ≥ x – 4/3 y ≥ x – 1.](/tpl/images/0285/8188/87afb.jpg)