PLEASE HELP! IM SO SLOW!
I have two questions about this graph.
1. a computer program fo...

Mathematics, 18.03.2021 02:10 luvme68297
PLEASE HELP! IM SO SLOW!
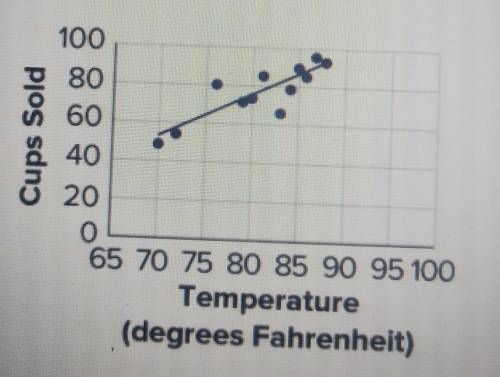
I have two questions about this graph.
1. a computer program found that the line C=2t-89 is a good fit for the data. Please use this graph to predict how many cups of lemonade Lynn might sell on a day when the temperature is 74 degrees.
2. the high temperature this Sunday is expected to be 5 degrees warmer than the high temperature this Saturday. Using the line C=2t-89, how many more cups of lemonade should Lynn expect to sell on Sunday than Saturday.

Answers: 1


Another question on Mathematics
Mathematics, 21.06.2019 21:40
What is the value of x in the equation 1.5x+4-3=4.5(x-2)?
Answers: 2
Mathematics, 22.06.2019 00:20
Ze trinomial x2 + bx – c has factors of (x + m)(x – n), where m, n, and b are positive. what is ze relationship between the values of m and n? explain how you got ze answer
Answers: 2
Mathematics, 22.06.2019 00:20
20 ! need ! which exponential function is represented by the table? f(x) = 0.2(0.5x)f(x) = 0.5(5x)f(x) = 0.5(0.2x)f(x) = 0.2(0.2x)
Answers: 1
You know the right answer?
Questions


History, 29.11.2021 22:50

English, 29.11.2021 22:50

Law, 29.11.2021 22:50
Mathematics, 29.11.2021 22:50
Mathematics, 29.11.2021 22:50
Business, 29.11.2021 22:50
Mathematics, 29.11.2021 22:50
Mathematics, 29.11.2021 22:50


