
Mathematics, 11.03.2021 09:20 gafsh272833
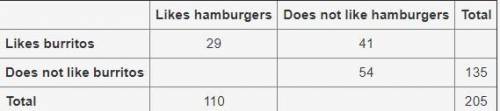
A food truck did a daily survey of customers to find their food preferences. The data is partially entered in the frequency table. Complete the table to analyze the data and answer the questions:
Likes hamburgers Does not like hamburgers Total
Likes burritos 29 41
Does not like burritos 54 135
Total 110 205
Part A: What percentage of the survey respondents do not like both hamburgers and burritos?
Part B: What is the marginal relative frequency of all customers that like hamburgers?
Part C: Use the conditional relative frequencies to determine which data point has strongest association of its two factors. Use complete sentences to explain your answer.
if you can, can you explain to me how you got the answer too? :)
this is what the table looks like

Answers: 3


Another question on Mathematics
Mathematics, 21.06.2019 17:30
Kathy spent 5/8 of her money on books and another 1/6 of her money on stationeries.what fraction of kathy’s money was left?
Answers: 2
Mathematics, 21.06.2019 22:30
Which of the functions below could have created this graph?
Answers: 1
You know the right answer?
A food truck did a daily survey of customers to find their food preferences. The data is partially e...
Questions

Spanish, 02.03.2020 18:27


Computers and Technology, 02.03.2020 18:27


Computers and Technology, 02.03.2020 18:27


Chemistry, 02.03.2020 18:27


Mathematics, 02.03.2020 18:27


