
Mathematics, 08.03.2021 22:20 amalalghalib14
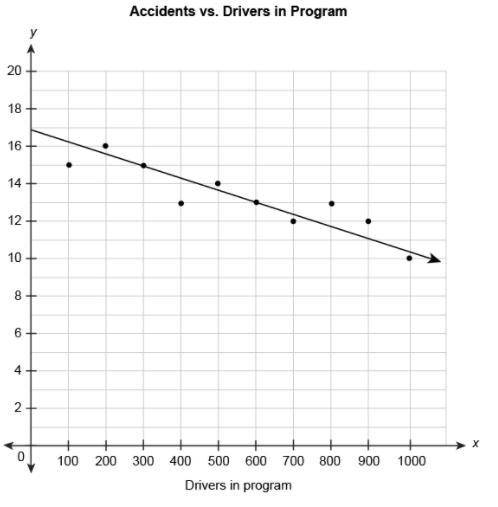
The scatter plot shows the relationship between the number of car accidents in a month and the number of drivers attending a program on distracted driving. The equation represents the linear model for this data.
y=−0.0067x+17
What does the number -0.0067 in the equation mean in this context?
The number of accidents was reduced by 0.67 per month for every additional 100 drivers in the program.
The number of accidents increased by 0.67 per month for every additional 100 drivers in the program.
The number of accidents was reduced by 0.67 per month for every additional driver in the program.
The number of accidents was reduced by 0.67 per month every month.
There were 0.67 accidents per month.
A graph measuring drivers in program in relation to accidents per month. A line indicates that accidents increase as drivers in program decreases.

Answers: 1


Another question on Mathematics
Mathematics, 21.06.2019 17:20
Which of these equations, when solved, gives a different value of x than the other three? a9.1 = -0.2x + 10 b10 = 9.1 + 0.2x c10 – 0.2x = 9.1 d9.1 – 10 = 0.2x
Answers: 1
Mathematics, 21.06.2019 20:00
The holiday party will cost $160 if 8 people attend.if there are 40 people who attend the party, how much will the holiday party cost
Answers: 1
Mathematics, 22.06.2019 00:00
If 7x=9y, y/z = 7/5 , then x/z = (a) 2/7 (b) 7/9 (c) 9/5 (d) 9/7 (e) 5/9
Answers: 1
Mathematics, 22.06.2019 00:00
Multiply and simplify. 2x^2 y^3 z^2 · 4xy^4 x^2 i will mark you brainliest if right. show how you got the answer, !
Answers: 3
You know the right answer?
The scatter plot shows the relationship between the number of car accidents in a month and the numbe...
Questions
Mathematics, 11.07.2019 00:00

Health, 11.07.2019 00:00

Mathematics, 11.07.2019 00:00

Mathematics, 11.07.2019 00:00

Computers and Technology, 11.07.2019 00:00

Social Studies, 11.07.2019 00:00

History, 11.07.2019 00:00


Business, 11.07.2019 00:00
Biology, 11.07.2019 00:00
Mathematics, 11.07.2019 00:00


