
Mathematics, 08.03.2021 22:00 liyah450
Will mark promise:)
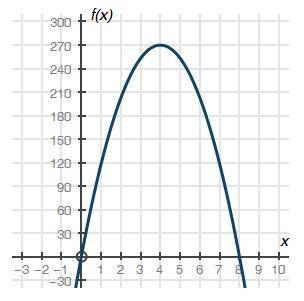
The graph below shows a company's profit f(x), in dollars, depending on the price of erasers x, in dollars, sold by the company:
Part A: What do the x-intercepts and maximum value of the graph represent? What are the intervals where the function is increasing and decreasing, and what do they represent about the sale and profit? (4 points)
Part B: What is an approximate average rate of change of the graph from x = 1 to x = 4, and what does this rate represent? (3 points)
Part C: Describe the constraints of the domain. (3 points)

Answers: 3


Another question on Mathematics
Mathematics, 21.06.2019 18:30
This is my question~~ ( r ^ 4 - 2r ^ 3 - 23 r ^ 2 - 4r - 32)÷(r+4) ~~ i must use long division to solve it : / i was wondering if anyone world like to solve it. and if so, share step-by-step explanations! you! ❤
Answers: 2
Mathematics, 22.06.2019 01:30
Becca wants to mix fruit juice and soda to make a punch. she can buy fruit juice for $3 a gallon and soda for $4 a gallon. if she wants to make 28 gallons of punch at a cost of $3.25 a gallon, how many gallons of fruit juice and how many gallons of soda should she buy?
Answers: 1
You know the right answer?
Will mark promise:)
The graph below shows a company's profit f(x), in dollars, depending on the pri...
Questions
Mathematics, 20.10.2019 16:50


Social Studies, 20.10.2019 16:50
Mathematics, 20.10.2019 16:50

World Languages, 20.10.2019 16:50
Mathematics, 20.10.2019 16:50
Mathematics, 20.10.2019 16:50

History, 20.10.2019 16:50
Mathematics, 20.10.2019 16:50


Biology, 20.10.2019 16:50
History, 20.10.2019 16:50

Chemistry, 20.10.2019 16:50

Business, 20.10.2019 16:50
Mathematics, 20.10.2019 16:50


